Preparation of SCT libraries
The protocol for SCT library preparation is presented in Fig. 1a. A peptide list was first converted into PCR-optimized DNA primers. Inverse PCR of each peptide-encoded primer onto an SCT plasmid template and re-circularization of the product generated each unique peptide variant of a plasmid library. Plasmids were then transfected into Expi293 cells over four days to induce secretion of the SCT protein product. The expressed SCT protein yield was then characterized by a custom Python script for sodium dodecyl sulfate-polyacrylamide gel electrophoresis (SDS-PAGE) gel analysis (Supplementary Fig. 1a–c), followed by biotinylation and His-Tag purification.
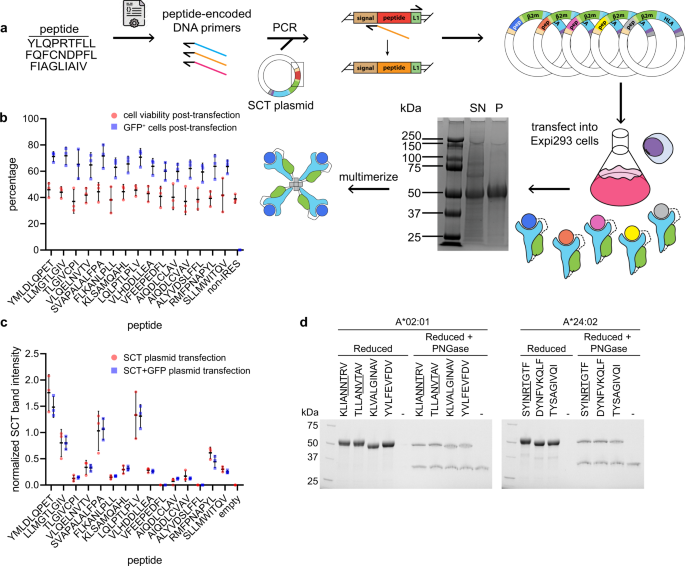
a Workflow of SCT production. Reduced SDS-PAGE gel showing expressed SCT protein (~50 kDa); SN supernatant, P His-Tag purified SCT. b Cell viability and transfection efficiency of SCT plasmid library. c SCT yield from each peptide element of the SCT plasmid library, with or without IRES-GFP reporter. Error bars represent standard deviation, n = 3 independent measurements. d Reduced SDS-PAGE gel of A*02:01 and A*24:02 SCTs pre- and post-PNGase treatment. NXT glycosylation motifs of peptides are underlined.
To explore the influence of peptide antigen on SCT yield, we prepared a library of 18 SCTs representing known HLA-A*02:01 epitopes (Supplementary Table 1) using a D3 template (see below). The protocol of Fig. 1a was modified to incorporate an IRES-GFP sequence following the SCT region, such that regardless of peptide identity or level of SCT expression, transfected cells would express intracellular GFP15 (Fig. 1b, c). Flow cytometry-based detection of GFP-positive cells indicated that transfection efficiency (~70%) was uniform across all tested SCT constructs (Fig. 1b). A biological triplicate of this subset, with and without the IRES-GFP insert, demonstrated consistent SCT yield variations suggesting that the individual peptide epitopes strongly influence the yield of their SCT library elements (Fig. 1c).
The SCTs are expressed in mammalian cells and so may incorporate post-translational modifications that would not be presented in folded pMHCs. We explored this effect by focusing on epitopes that contained the NXT glycosylation consensus sequence. In fact, for SCTs containing such sequences, SDS-PAGE analysis revealed a slightly elevated mass, the origin of which could be confirmed by analyzing the SCTs following de-glycosylation (Fig. 1d). Thus, SCTs can undergo biological protein processing and so have the potential to contain relevant post-translational modifications.
We also compared SCT library yields versus pMHC libraries generated by UV exchange. Starting with A*03:01-restricted putative neoantigens predicted from a melanoma patient16, SCTs were assembled using templates D3 and D8 (see a fuller description of these templates below), while the pMHC library was prepared by UV exchange using literature protocols3,5. An ELISA assay measuring anti-β2m antibody absorbance was conducted to quantify UV exchange efficiency for each peptide element of the library. A comparison of the SCT yields and UV exchange efficiencies for each peptide (Supplementary Fig. 1d) showed that peptides that lead to high SCT expression generally also exchanged well into UV-pMHCs, and vice-versa.
Optimizations of SCT template design
We next constructed an expanded SCT library with the 18 HLA-A*02:01 epitopes analyzed above and explored the roles that various reported L1/HLA template mutations exerted on both SCT expression yield and SCT performance as an antigen-specific T cell capture agent. Three generations of L1-HLA combinations [closed groove (wild-type HLA), open groove (HLA Y84A), and thiol linker (HLA Y84C)] have been reported as stabilizing (see Fig. 2a for the locations of these mutated residues). We introduced these genetic variants into five unique designs, D1–D910,11,12 (Fig. 2b). Designs that contain cysteine in the linker (D3–D5) incorporate the HLA Y84C mutation to complete a dithiol linkage. Three templates also contained an H74L mutation13 (D6–D8), which forms a portion of the C pocket in the peptide binding groove of the HLA subunit and has been reported to facilitate peptide loading and immunogenicity. Our final design (D9, termed DS-SCT) was inspired by a recent report that the Y84C-A139C mutation in the HLA molecule could introduce further stabilization17,18,19. This 162-element plasmid library (9 HLA templates × 18 peptides) was transfected into Expi293 cells (Fig. 2b). Reduced amounts of the SCT protein bands based on SDS-PAGE analysis were associated with variations in protein yield dependent on peptide and template (Fig. 2b). Templates containing thiol linkers (D3–D9) produced the highest overall yields. For certain peptides, such as AIQDLCLAV and AIQDLCVAV, the strong expression could only be obtained with the D8 template, which incorporates both H74L and thiol linker features.
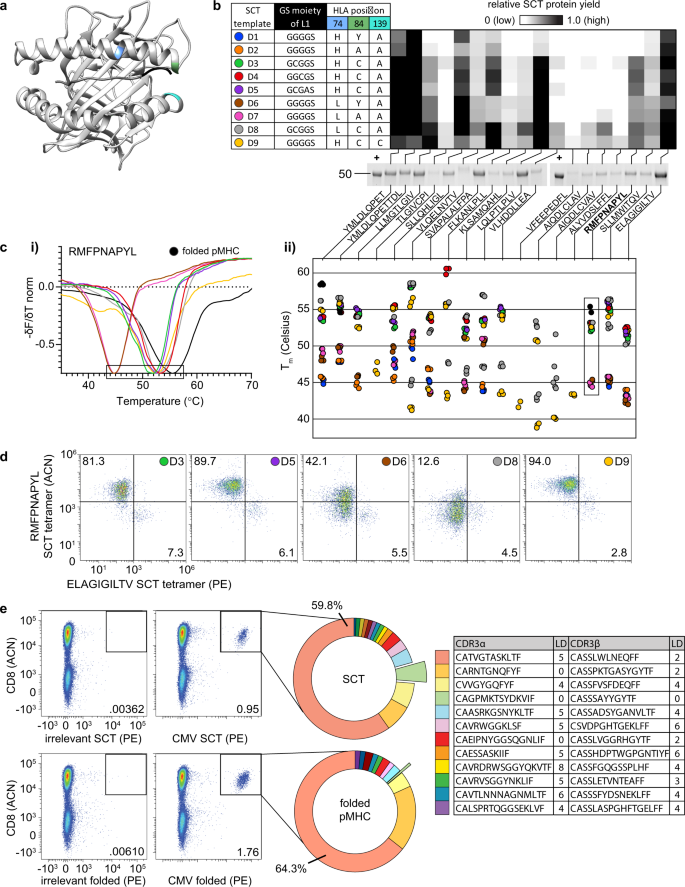
a Axial view of HLA-A*02:01 SCT crystal structure (RDB ID: 6APN). Highlighted regions of interest: H74 (blue), Y84 (green), A139 (cyan), and the first three amino acids of the L1 linker (black). b Table: L1 and HLA amino acid modifications for each SCT template. Heatmap: Relative expression of each SCT combination (n = 3), designated by template (row) and peptide (column), and exemplified by reduced SDS-PAGE of 18 SCTs constructed using design template D9. Previously expressed and a purified aliquot of WT1 SCT is used as a positive control (+) for band intensity quantification. c Thermal melting profiles of SCTs. The negative of the change in fluorescence over the change in temperature (−δF/δT) is measured for SCTs encoding WT1 peptide (c.i). Local minima representing Tm values (see the boxed region of WT1 plot) are plotted (c.ii) for each SCT template and peptide (n = 3). d WT1 SCTs constructed according to each of the six template designs were paired with a MART-1 SCT (D3 template) to identify cognate TCR-transduced cells. The number/color at the top right of each plot indicates the SCT template used for WT1 SCT tetramer in the flow assay. Percentages indicate the proportion of the total cell population captured in the WT1 SCT-positive quadrant. e Capture of CMV-specific T cells using SCT or refolded pMHC format. Unique paired TCR clonotypes identified by 10× single-cell sequencing of tetramer-positive cells. CDR3a and CDR3b sequences of the twelve most frequently captured clonotypes from SCT tetramer along with LD to publicly reported CMV-specific clonotypes from VDJdb are reported in the Table. L1 linker 1, WT1 RMFPNAPYL, MART-1 ELAGIGILTV, CMV NLVPMVATV, LD Levenshtein distance, VDJdb VDJ database, ACN allophycocyanin, PE phycoerythrin.
We explored the thermal stability of this SCT library through thermal shift assays, which utilize differential scanning fluorimetry to measure the intensity of a fluorescent dye (SYPRO orange) that binds to hydrophobic regions of the protein. Less thermally stable proteins exhibit lower melting temperatures. SCTs that were expressed above a yield threshold were HisTag-purified into PBS buffer at pH 7.4. The measured Tm values were within expected literature ranges20 and revealed a trend of increased stability for the same peptide from closed groove to open groove to thiolated linker/groove (Fig. 2c.i–ii). For three peptides (YMLDLQPET, YMLDLQPETTDL, and RMFPNAPYL), folded pMHCs were shown to exhibit a higher relative Tm than their SCT counterparts (Fig. 2c.ii). Across all peptides, SCT thermal stabilities were also higher for H74L variants than wild-type counterparts. For some peptides (such as AIQDLCLAV) or some template/peptide combinations (such as D7/YMLDLQPET), we detected two distinct melting temperatures. We speculate that the lower temperature arises from an improperly folded SCT, and so we utilize the higher value in Fig. 2c.ii (Supplementary Fig. 2a).
We validated the functionality of the SCT constructs for the Wilms Tumor 1 (WT1) peptide (RMFNAPYL) by assessing tetramer binding of the WT1-specific C4αβ-TCR against select templates (D1, D2, and D7 expression were too low for use) (Fig. 2d)21. Expressed WT1 SCTs were purified and then combined with MART1-specific F5 TCR-transduced Jurkat cells in a 95/5 ratio for use in binding assays. We used the MART1 epitope-presenting SCT tetramer (D3 template, Supplementary Fig. 2b) as a stable control. For the WT1 epitope-presenting SCT tetramers, the D3, D5, and D9 templates all yielded excellent performance, selectively capturing 81–94.0% of the WT1-specific cell population (Fig. 2d). Thus, the best tetramer performance did not necessarily correlate with the highest thermal stability. The D8 WT1 SCT design, for instance, comes closest to matching the thermal stability of the folded pMHC but performs poorly. We selected templates D3 and D9 for additional experiments since both exhibited good thermal stability and excellent performance as antigen-specific T-cell capture reagents.
We next compared antigen-specific CD8+ T cell capture performance of D3-template SCT multimers and folded pMHC multimers by obtaining sequences of CDR3 regions from TCR α and β chains captured using these reagents. The HLA-A*02:01-restricted CMVpp65 CD8+ T cell epitope peptide (NLVPMVATV) was used in interferon (IFN)-gamma ELISPOT assay to identify a CMV-reactive healthy A*02:01 donor for this experiment. This CMVpp65 SCT and its folded pMHC counterpart were multimerized into barcoded dextramers to isolate CMV-specific T cells for 10× single-cell TCR sequencing. A similar distribution of antigen-specific clones was captured by the two reagents (Fig. 2e). Levenshtein distances (LD) of the CDR3α and CDR3β chains against a public database (Fig. 2e, table) indicated high similarity between the detected CMV-specific TCR chains and those previously reported22. Two paired clones (red and light orange wedges of Fig. 2e) exactly matched literature CDR3 sequences (LD = 0). An additional clone (light green wedge, Fig. 2e), containing an α/β pair for which both chains have been reported as CMV-specific23,24, was captured by the SCT at a tenfold higher frequency relative to the folded pMHC. Thus, SCT tetramers appear to have at least a similar flow cytometry performance to the gold standard of folded pMHCs.
SCT libraries capture functionally relevant virus-specific T cells
We next explored how SCT libraries might be used to improve and streamline literature protocols for the capture of antigen-specific T cells through the successive exploration of three methods (Fig. 3a–d). We started with an established protocol and then used SCT libraries to streamline and simplify that protocol. Using template D3, we first expressed an SCT library targeting 66 known epitopes from common viral strains (CMV, EBV, influenza, and rotavirus) for A*02:01 and A*24:02 (Supplementary Table 2). We then selected the ten most highly expressed SCTs for each HLA and synthesized the corresponding peptides. These SCT and peptide reagents were then applied across all three methods.
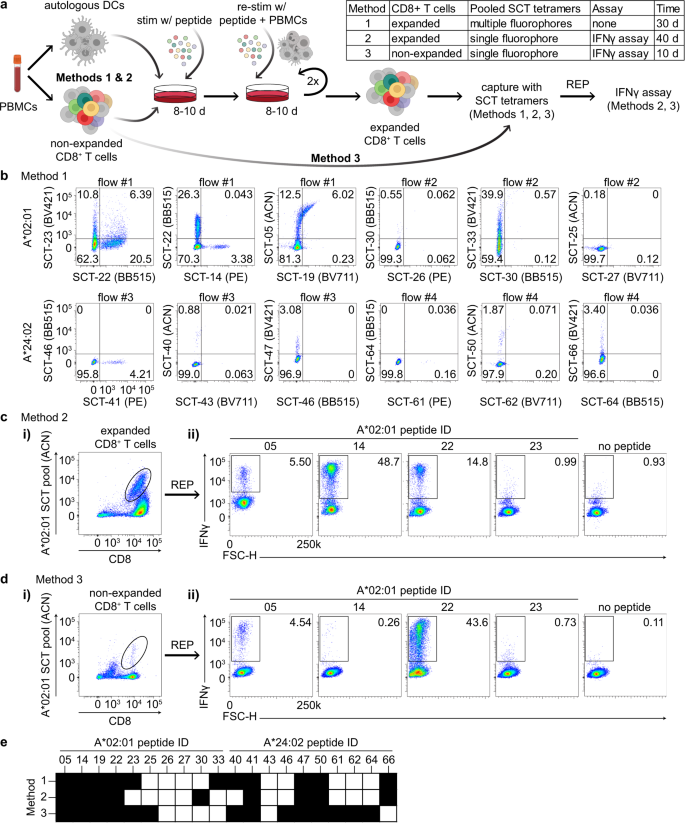
a Workflow of antigen-specific T-cell identification using SCT tetramers (created with BioRender.com). b Representative flow cytometry plots of CD8+ T cells captured by 5-color pooled SCT tetramers from peptide-stimulated and expanded CD8+ T cells (Method 1) (n = 10). c, d Representative flow cytometry plots of CD8+ T cells initially captured by single-color pooled SCT tetramers from peptide-stimulated and expanded CD8+ T cells (ci) (Method #2) or from non-stimulated, non-expanded CD8+ T cells (d.i) (Method #3). Subsequent flow plots represent IFNγ+ cells after peptide stimulation of expanded cells from the previously captured tetramer-positive subset (c.ii, d.ii). e, Binary mapping of peptides which elicit positive signal based upon tetramer binding (Method 1) or IFNγ release (Methods 2 and 3). Values in flow cytometry plots indicate the percentage of the total cell population captured within the quadrant or outlined box. Peptide sequences are found in Supplementary Table 2. REP rapid expansion protocol, BV421 Brilliant Violet 421 nm, BB515 Brilliant Blue 515 nm, PE phycoerythrin, ACN allophycocyanin, BV711 Brilliant Violet 711 nm.
For Method 1 (Fig. 3a), we used a well-established protocol to generate antigen-specific T cell lines specific for the selected peptides25,26. Briefly, monocytes were isolated from healthy donor PBMCs (either A*02:01 or A*24:02) and matured into dendritic cells with a cytokine cocktail. Mature DCs were incubated with 1 µg/mL of pooled HLA-restricted peptides and then irradiated. This promotes the presentation of the peptide antigens by these DC cells while also rendering the DC cells non-proliferative. CD8+ T cells purified from autologous PBMCs were then incubated with these peptide-loaded DCs for 8–10 days to induce selective stimulation and expansion of antigen-specific CD8+ T cells. The T cell lines were twice again stimulated and expanded with peptide-pulsed irradiated autologous PBMCs. For each HLA allele, this process was replicated 10× using separate aliquots of CD8+ T cells from the HLA-matched donor. To test these expanded T cell populations for specificity to the 20 peptides, we prepared four pools, each comprised of 5 SCT tetramers conjugated to different fluorochromes. The individual lines from each HLA-matched donor were then analyzed by 5-color flow cytometry (Fig. 3b, see Supplementary Fig. 3a for gating strategy) using these SCT tetramer pools (see Methods). In this way, the flow cytometry assay identifies which antigens promoted clonal expansions and which ones were irrelevant, and it tests for binding selectivity against those relevant antigens. SCT tetramer-positive T cell populations were identified from each line, with little evidence of cross-reactivity across the other relevant and irrelevant SCTs. This indicates that for these subsets of peptides and for each donor, T cell populations exist that selectively bind to peptides presented via antigen-presenting cells (APCs) and also bind to the cognate SCTs (Fig. 3b).
The success of Method 1 suggested the potential for a larger library approach for the isolation and characterization of antigen-specific T cells. Therefore, for Method 2 (Fig. 3a), we explored whether a population of antigen-specific T cells with a broad diversity of antigen specificities could be identified from a polyclonal T cell pool when tetrameric SCTs were pooled together into a library format. We first assessed Method 2 using the antigen-enriched T cell lines described above (Fig. 3b), where the breadth of available antigen specificities was known. All T cell lines from each donor were pooled and stained with a pooled library of SCT tetramers, where all 10 SCTs were conjugated to allophycocyanin (ACN) dye and then combined as a single staining solution. The sample was sorted for ACN-positive T cells (Fig. 3c.i), which were then expanded using a T cell rapid expansion protocol (REP)27. To assess the frequency of T cells with distinct antigen-specificities within this population, we assessed IFNγ production by the expanded cells in response to each peptide (Fig. 3c.ii, see Supplementary Fig. 3b for gating strategy). The responding cells contained T cell specificities that closely matched those found in Method 1 (Fig. 3e), confirming that T cells that bind each of the tested SCTs are, in fact, reactive against the native peptide. Thus, Methods 1 and 2 show that SCTs may be pooled together to capture and promote the expansion of targeted antigen-specific T-cell populations.
For Method 3 (Fig. 3a), we asked whether we could use the same library of SCTs to purify similar populations of T cells from unmanipulated CD8+ T cells ex vivo isolated from the donor PBMCs. This streamlined approach can circumvent the 20 days of PBMC-facilitated peptide stimulation and expansion of Methods 1 and 2. We prepared ACN-conjugated SCT tetramers in a pooled, single-fluorophore format (identical to Method 2) to directly sort (Fig. 3d.i) non-expanded CD8+ T cells from the same donors. T cells were then expanded using the same REP (Fig. 3a). Figure 3d.ii shows the measurements of IFNγ secretion of tetramer-sorted and expanded CD8+ T cells from A*02:01 donor PBMCs upon individual peptide stimulation. Additional data is provided in Supplementary Fig. 3c–e for the other A*02:01 and A*24:02 peptides. Notably, the epitopes for which T cells could be isolated were very similar across all three methods (Fig. 3e). Variations in the frequency of some epitope-specific TCRs were observed, likely reflecting differences in peptide affinity and/or in vitro expansion. Method 3 thus demonstrates that the clonal repertoire in terms of peptide-reactivity could be recapitulated using a pooled SCT and streamlined expansion protocol. This highly efficient method should also reduce expansion bias against the native TCR repertoire.
The above studies were done with well-characterized immunodominant viral epitopes. We next assessed whether this approach could be effectively used to evaluate predicted epitopes from a less characterized pathogen.
SCT libraries enable the rapid discovery of immunodominant SARS-CoV-2 epitopes
To enumerate the epitope landscape of SARS-CoV-2-specific CD8+ T cells, we generated SCTs encoding putative antigens. The NetMHC4.0 binding prediction algorithm was used to identify 9- to 11-mer peptide sequences from the spike protein with 500 nM or stronger binding affinity28 to either HLA-A*02:01, A*24:02, or B*07:02. We identified 96, 51, and 33 peptides for these alleles, respectively, with some overlap against published lists of putative antigens29,30,31. The A*02:01 SCTs exhibited useable levels of expression for epitopes throughout the protein except for the trans-membrane (TM) region, which had uniformly weak expression (Supplementary Table 3). B*07:02 SCT expression showed a preference for the N-terminal domain (NTD), the S1/S2 cleavage site, and parts of the S2 subunit (Supplementary Table 4), while highly expressed A*24:02 SCTs were concentrated around the NTD, the receptor binding domain (RBD), and TM regions (Supplementary Table 5). The same prediction process was performed for the Nsp3 protein (papain-like protease, PLpro) for A*02:01 to produce 191 peptides (Supplementary Table 6). All SCTs were generated using the D9 template (Fig. 2b). The B*07:02 SCT library was also expressed using the D3 template. While most SCTs expressed using the D9 template were also expressed with the D3 template (and vice versa), the expression levels were generally higher for D9 (Supplementary Fig. 4a, b), perhaps suggesting that D9 is a superior template. The most strongly expressed SCTs (see Methods) were assembled into four libraries.
We first used these libraries to ask whether immunogenic epitopes were shared among HLA-matched COVID-19 participants. SARS-CoV-2 SCTs from each library were assembled into PE-tetramer reagents and pooled to stain and sort for antigen-specific T cells from PBMCs collected from three participants per HLA haplotype (Fig. 4a), plus PBMCs from a (never infected) A*02:01 healthy donor. An A*02:01 SCT expressing the CMV pp56 peptide was conjugated with ACN-streptavidin and served as a control. Captured T cells were then expanded using the REP, and antigen specificity was confirmed by flow cytometry with individual SCT tetramers (Fig. 4b). SARS-CoV-2-specific CD8+ T cells against the same epitopes were detected in different participants (Fig. 4b), suggesting that, for a given HLA haplotype, immunodominant epitopes are present, consistent with other reports32,33,34,35,36,37,38. In fact, certain antigen-specific T-cell responses detected here (against epitopes QYIKWPWYI, NYNYLYRLF, SPRRARSVA, and YLQPRTFLL, although YLQPRTFFK was found here to be more immunodominant), have been reported elsewhere35,37,38,39. Note that CMV-specific T cell populations were initially detected in the unexpanded PBMCs from the two A*02:01 COVID-19 participants (1.22% and 0.24%) and detected at 13.2% and 7% after T cell expansion, respectively, again indicating that antigen-specific T cells resting in blood could be successfully captured and expanded using SCT tetramers (Supplementary Fig. 4c.i–iv).
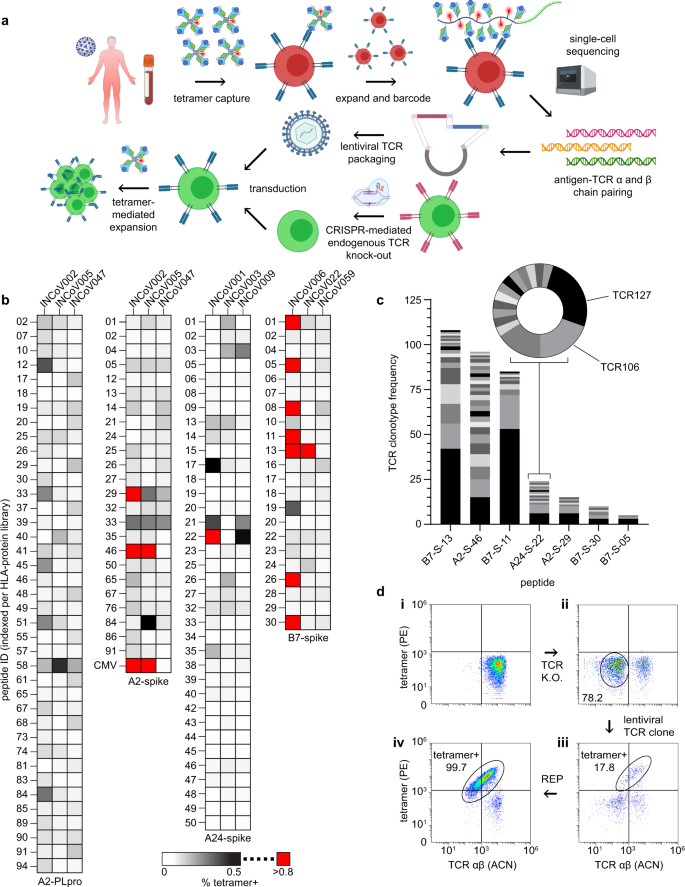
a Workflow for SCT-facilitated capture of SARS-CoV-2 antigen-specific CD8+ T cells, single-cell TCR sequencing, and TCR cloning into autologous T cells (created with BioRender.com). b SCT tetramer-positive CD8+ T cells from HLA-matched COVID participants for SCT libraries (n = 1). c Frequency of unique TCR clonotypes against peptides whose SCTs produced high % tetramer binding (red boxes of (b)). d Representative flow cytometry plots of T cell cloning workflow. Autologous T cells (d.i), T cells after CRISPR-mediated TCR knockout (d.ii), tetramer+ T cells after lentiviral TCR cloning (d.iii), tetramer+ T cells after sort and REP (d.iv). Peptide sequences are found in Supplementary Tables 3–6. A2 A*02:01, A24 A*24:02, B7 B*07:02, PLpro papain-like protease, P PLpro, S spike, PE phycoerythrin, ACN allophycocyanin, REP rapid expansion protocol.
To probe the TCR repertoire of the SARS-CoV-2-specific T cells, selected expanded populations were stained with SCT-loaded DNA-barcoded dCODE dextramers (Immudex) to enable pairing of the SCT capture reagent with specific TCR clonotypes through 10× single-cell sequencing (Fig. 4a). For 7 SCTs representing 7 antigens and 3 HLA alleles, we identified a predominant clonotype (Fig. 4c) and many subdominant clonotypes. Several of these clonotypes were selected for cloning.
Primary CD8+ T cells from HLA-matched healthy donors were used to clone putative SARS-CoV-2 antigen-specific TCRs. Flow cytometry (Fig. 4d) was used to monitor key steps in the cloning process (see Methods), including CRISPR/Cas9 knockout of the endogenous TCR α/β chains40 (Fig. 4d.i, ii). SCT tetramers were used to assess both the effectiveness of the lentiviral transduction of new TCR α/β genes (Fig. 4d.iii) as well as the purity of the subsequently expanded TCR-engineered cells (Fig. 4d.iv). Using this process, we prepared 31T cell clonotypes representing specificities against 13 different SARS-CoV-2 antigens presented by 3 HLA alleles, plus 2 positive controls.
Functional characterization of SARS-CoV-2 antigen-specific CD8+ T cells identified using SCT libraries
We performed functional assays to confirm that TCR-engineered T cells were responsive to stimulation with the target peptide (Fig. 5a). T cells engineered with SARS-CoV-2-specific TCRs were co-cultured with HLA-matched APCs41 at an effector-to-target ratio of 2:1 with and without peptide loading (1 µM). We included A*02:01/NY-ESO-1157–165 and A*02:01/CMV pp56495–503 antigen-specific TCR-engineered CD8+ T cells as positive controls.
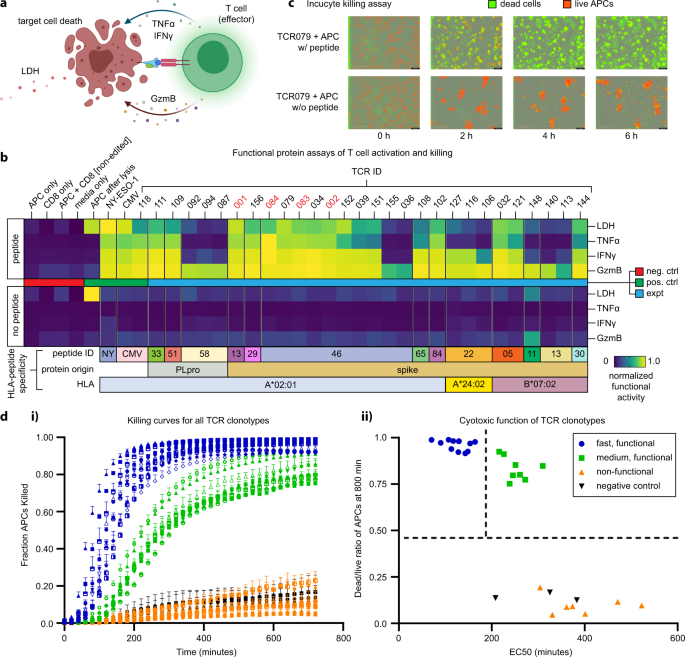
a Illustration of functional assays, including T cell-secreted markers of activation and cytotoxicity following antigen-specific activation, as well as the release of LDH following T cell killing of APCs (created with BioRender.com). b Heatmap representing measured levels of secreted or released proteins from T cell clonotypes with or without peptide stimulation (n = 2). TCRs indicated in red font were identified from healthy donors. c IncuCyte live-cell imaging of peptide stimulation and cell-killing activity. Scale bars in each panel represent 400 μm. d.i. Measurements of the fraction of dead APCs from IncuCyte kinetic imaging analysis of the TCR-engineered T cell clonotypes co-cultured with APCs. Error bars represent standard deviation from independent triplicate measurements. d.ii. Classification of T cell clonotypes by killing activities. TCR sequences are found in Supplementary Table 7. LDH lactate dehydrogenase, TNFα tumor necrosis factor α, IFNγ interferon γ, GzmB granzyme B, NY SLLMWITQC (NY-ESO-1), CMV NLVPMVATV, A2 A*02:01, B7 B*07:02, APC antigen-presenting cell, P PLpro, S spike.
Following 16 h of co-culture, we assayed the supernatant for three effector molecules (TNF-α, IFN-γ, and Granzyme B) that would be secreted from the TCR-transduced primary CD8+ T cells, as well as lactate dehydrogenase (LDH), which is released from lysed target cells. All proteins were measured by ELISA, except LDH, which was assessed using a standard non-radioactive cytotoxicity assay (see Methods). Measurement results are separately normalized by the highest value in each readout and plotted on a heat map. All the negative controls and all TCRs co-cultured with APCs in the absence of target peptide (but at the same DMSO concentration) produced non-detectable levels of functional proteins as well as LDH (Fig. 5b). By contrast, most SARS-CoV-2 specific T cells (20/31), as well as positive controls NY-ESO-1157–165 and CMV pp56495–503 specific T-cells secreted detectable levels of effector molecules and promoted apoptosis following activation with APC loaded with the correct peptide (Fig. 5b). All SARS-CoV-2 specific T cell clonotypes produced levels of Granzyme B above that of the negative controls, while subsets produced TNF-α and IFN-γ. Positive correlations were found between all three effector molecules and the assayed LDH levels (Supplementary Fig. 5a–c) (TNF-α: r = 0.91, p < 0.0001; IFN-γ: r = 0.87, p < 0.0001; Granzyme B: r = 0.67, p < 0.0001).
Target killing by T cells expressing TCR-079 was assessed with APCs loaded with or without 1 µM cognate peptide (RLITGRLQSL) in an Incucyte live-cell imaging assay with a caspase activation reporter (Fig. 5c). For this assay, we labeled the APCs with live-cell dye (red). These cells were then co-cultured with the engineered CD8+ T cells (unlabeled) and with a reagent that captures caspase 3/7 (green) activation. Fluorescent images were collected every 20 min for 12 h. Quantification of green/red fluorescent areas at each time point provided the metric for tracking the kinetics of target cell killing. For this TCR/APC combination, most cell killing events occurred within 4 h, leading to nearly complete eradication of the APCs. This analysis revealed a broad spectrum of cell-killing activity across the TCR-engineered clonotypes (Fig. 5d.i) and a positive correlation with the LDH measurement assay (Supplementary Fig. 5d).
The time course killing curves (Fig. 5d.i) were fitted to sigmoidal functions (see Methods) to extract two comparative killing metrics for assessing the differences between the TCR clonotypes. The first metric was the EC50 value, which is the point of the steepest slope of the sigmoidal fit to the killing curve, and the second metric was the dead/live cell ratio at 12 h (Supplementary Fig. 5e). This analysis defined three TCR groups (Fig. 5d.ii). T cells expressing group 1 TCRs (blue curves in Fig. 5d.i and blue circles in Fig. 5.d.ii) were labeled ‘fast and functional.’ These cells exhibited a fast killing response (EC50 < 200 min) with a dead/live cell fraction >0.9. Group 2 (green; slow and functional) exhibited an EC50 > 350 min but a similar dead/live cell fraction >0.75 as Group 1. Group 3 TCRs (orange, non-functional) exhibited a poor killing response. A full list of TCRs, their cognate antigens, and their groupings is provided in Supplementary Table 7. Note that the NY-ESO-1157–165 and CMV pp56495–503 positive controls were classified as ‘functional.’ This data shows that antigen-paired TCRs identified through the protocol of Fig. 4a reflect the full spectrum of antigen-specific T cell responses, including a large fraction of highly potent TCRs.
