The Labour and Green parties would be able to form a
coalition government, according to the latest Horizon
Research poll.
The May 12-17 survey of 1,563 adults
finds that among those who are both registered and 100%
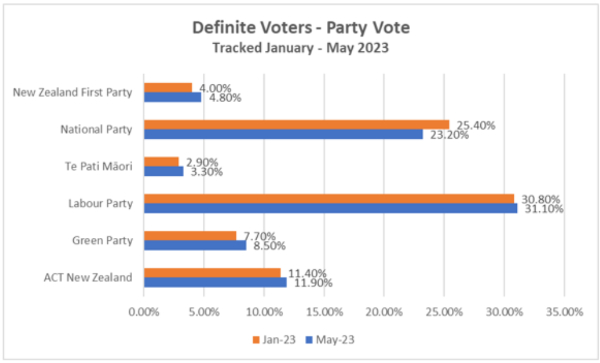
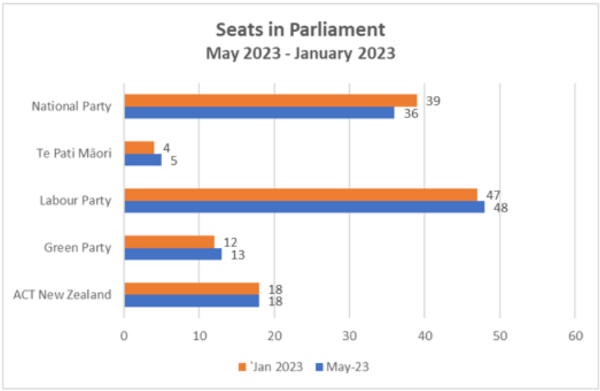
likely to vote, Labour would attract 31.8% of the vote and
get 48 seats in Parliament.
The Green Party would
attract 8.5% of the definite vote and get 13 seats: a
combined 61 seats and a majority in a 120-seat
Parliament.
National would attract 23.2% (down from
25.4% in January 2023) and get 36 seats (three less than in
a January Horizon survey).
ACT would attract 11.9% and
get 18 seats: a combined 54 seats, 7 fewer than a
Labour-Green coalition.
The seat results assume an
electorate seat is won by Te Pāti Māori, giving it 5 seats
for its 3.3% share of the vote.


National’s
share of seats is down 3 from 39 in
January.
Labour’s share is up 1 from 47.
ACT
and Green vote shares are steady.
The results are for
respondents who are both registered to vote and 100% likely
to vote.
10% of those surveyed remain
undecided.
The survey closed a day before the
Government presented its 2023 Budget.
New Zealand
First, at 4.8%, is close to crossing the 5% threshold to
enter Parliament without the need to win an electorate
seat.
If it were to achieve 5%, this would give it
around 7 seats. A NZF, ACT, National coalition would then
have 58 seats, still short of the 61 needed for a majority
in a 120 seat Parliament.
If NZF were to get 5%,
Labour and Green would have a combined 57 seats and would
need Te Pāti Māori, with 5 seats, for a 62 seat
coalition.
Horizon says the survey indicates most
parties are holding their ground, though National slipped
2.3% between the January and May
surveys.
Labour versus National by age,
gender, household type, income and
region
Labour has more support across all age
groups than National, except among 35-44
year-olds.
Among 18-24 year-olds Labour has 28%
support, National 12%. Among 34-44 year-olds National has
25% support, Labour 6%.
Labour has 25% of men and
National 24%.
However, among women Labour has 30%
support, National 19% and 11% lead for Labour.
Labour
(26%) and National (25%) are even among those who are
employed and Labour has a 17% lead over National among those
who are not employed.
| If a general election were to be held tomorrow, for which of the following political parties would you cast your party vote? |
ALL | EMPLOYED | |
| Yes | No | ||
| ACT New Zealand |
10.0% | 9.5% | 11.2% |
| AdvanceNZ | 0.5% | 0.5% | 0.4% |
| Green Party |
7.7% | 8.7% | 5.7% |
| Labour Party |
27.9% | 25.6% | 32.3% |
| Māori Party |
3.5% | 3.9% | 2.7% |
| National Party |
21.5% | 24.9% | 15.0% |
| New Conservative Party |
1.1% | 1.5% | 0.5% |
| New Zealand First Party |
4.3% | 3.5% | 5.8% |
| The Opportunities Party |
2.3% | 2.9% | 1.3% |
| Another party |
2.2% | 2.5% | 1.5% |
| I would choose not to vote |
3.0% | 3.0% | 3.2% |
| I am not eligible to vote |
1.1% | 0.6% | 2.1% |
| I really don’t know |
14.8% | 13.0% | 18.3% |
| N (unweighted) |
1,563 | 1,051 | 512 |
Among
Māori, Labour has 34% support, Te Pāti Māori 34% and
National 6%.
Regions:
By
region, Labour is 5% ahead of National in Auckland,9% in
Northland, 8% in Manawatu- Whanganui, 8% in Wellington, 27%
in Nelson/Marlborough and 16% in Canterbury.
National
is 11% ahead of Labour in the Bay of Plenty and 7% ahead of
Labour in Southland.
In cyclone affected
Gisborne-Hawes Bay Labour has 28% support, National
26%.
Horizon Research says the results indicate Labour
is having an issue with 35-44 year-olds, but holding more
support than National across all other age groups, including
the elderly. National is having issues with attracting
support from women and in some of the
regions.
Methodology
The online
survey has 1,563 respondents. Results are weighted on, age,
personal income, party voted for in 2020, employment status,
region and ethnicity. At a 95% confidence level the maximum
margin of error on the results overall is +/-
2.5%.
Horizon asks respondents if they are registered
to vote, how likely they are to vote from 0$ to 100%, and
then reports results by those who are registered and 100%
likely to vote.
Respondents are grouped by region, not
electorate, to provide more reliable sample sizes though
results are indicative only where 50 or fewer have responded
in a region.
Horizon has no political party client for
the poll and conducted the survey as party of its public
interest research
programme.
© Scoop Media
