LARS-associated symptom subgroups
Among 109 patients, 91 were classified into major LARS and 18 into minor LARS. The baseline characteristics of patients were shown in Supplementary Table S1. The mean age was 62.2 years, and 101 (92.7%) of patients were males. The mean tumor location from the anal verge was 7 cm, and 58.7% of patients had diverting ileostomy followed by ileostomy reversal. Preoperative or postoperative radiotherapy was administered in 55 (50.5%) patients, and 3 (2.8%) patients experienced anastomotic leakage.
The questionnaire items for frequency, clustering, and urgency were grouped and contributed to the first PC variable (PC1LARS) in the PCA. Others, including liquid stool incontinence and flatus incontinence, accounted for a greater proportion of the second PC variable (PC2LARS) (Fig. 1).
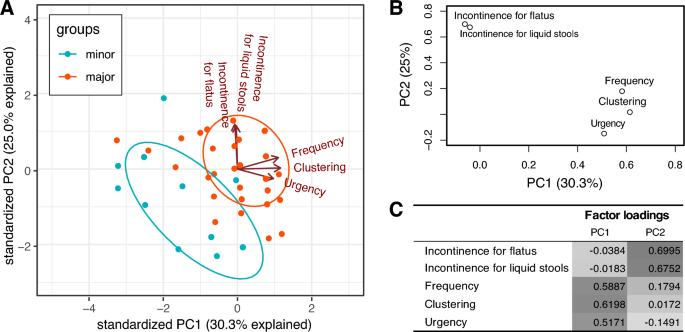
Principal component analysis (PCA) using low anterior resection syndrome (LARS) score from 109 patients. (A) PCA scores biplot, (B) loading plot of PCA on LARS questionnaire items, (C) factor loadings for each principal component (PC). It explains that there is 55.3% of total data variance with two principal components.
In addition, the sum of scores for items regarding frequency, clustering, and urgency was referred to as sub1LARS, while the sum of scores for incontinence for flatus and liquid stools was referred to as sub2LARS. Therefore, similar to the previous research33, the PC1LARS and sub1LARS corresponded to the frequency-dominant LARS, and the PC2LARS and sub2LARS corresponded to the incontinence-dominant LARS.
Table 1 summarizes the description of these LARS-associated variables and the range of each variable. For the totalLARS, pre-defined indicators of LARS questionnaires were applied. To further interpret the new symptom-based LARS subgroups, we introduced grouping criteria for each LARS-associated variable. In the case of subgrouping items in the LARS questionnaires, binary group variables derived from the new continuous variables were devised. The criteria applied to each level are shown in the “levels” column of this table. Supplementary Table S2 summarizes the distribution of the LARS-associated variables.
The cutoff value of LARS-associated binary variables was determined by considering the distribution of patients. In the sub1LARS, the “severe” classification was determined when bowel frequency was more than four times a day together with clustering symptom and urgency at least once a week. In the sub2LARS, “severe” refers to symptoms of incontinence for both flatus and liquid stools that occur at least once per week (Supplementary Table S3). The two group factors were significantly independent of each other (chi-square = 0.410, P = 0.522).
Microbial diversity
Microbial alpha diversity was measured using different methods for richness and diversity in order to compare the LARS groups (Table 2). No significant correlation was noted between the totalLARS score and all alpha-diversity indices, whereas a significant correlation was noted between the sub1LARS score or sub2LARS and alpha diversity richness. Briefly, the microbial richness index, including Observed feature number and Chao1, was monitored, revealing a significantly negative correlation in sub1LARS [Spearman correlation coefficient (ρ) = −0.217, P = 0.023 with Observed feature number; ρ = −0.222, P = 0.020 with Chao1], while showing a significantly positive correlation in sub2LARS (ρ = 0.221, P = 0.021 with Observed feature number; ρ = 0.221, P = 0.021 with Chao1).
Further, a mean comparison analysis of the alpha diversity indices for each LARS-associated binary variable was performed (Fig. 2). The microbial richness, assessed using Chao1, was significantly lower in the severe level of sub1LARS_group [median 115 (SD 59.1) vs. 146 (57.7), severe vs. mild, respectively, P = 0.0487] but higher in the severe level of sub2LARS_group [132 (60.1) vs. 112 (55.5), P = 0.0419]. Beta-diversity showed no difference between LARS groups (Supplementary Fig. S1).
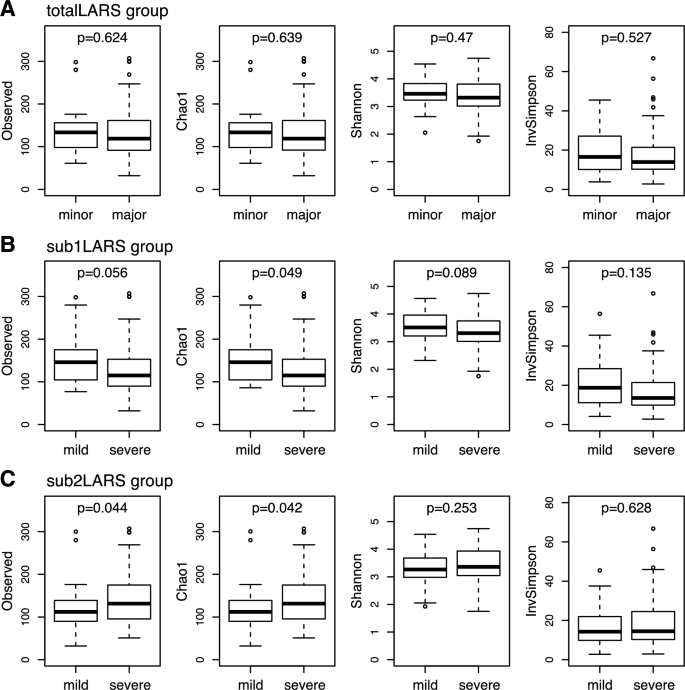
Comparison of microbial alpha-diversity between low anterior resection syndrome (LARS) groups. (A) totalLARS_group, (B) sub1LARS_group, (C) sub2LARS_group. Wilcoxon rank-sum tests were performed in each comparison, and nominal P-values are shown.
Severity of LARS according to enterotypes of the gut microbiome
The gut microbiome was clustered into three enterotypes, to which the main bacterial taxa contributing were Prevotellaceae, Ruminococcaceae, and Bacteroidaceae at the Family level (Fig. 3a). A different composition was identified in the sub1LARS_group compared with sub2LARS_group and totalLARS_group (Fig. 3b). In the severe sub1LARS_group, the proportion with Bacteroidaceae enterotype was higher, and those with Prevotellaceae enterotype tended to be lower than those in the mild sub1LARS_group (P = 0.692). In contrast, sub2LARS_group and totalLARS_group showed higher Prevotellaceae enterotype in the severe group than in the mild group (P = 0.625 and P = 0.311, respectively).
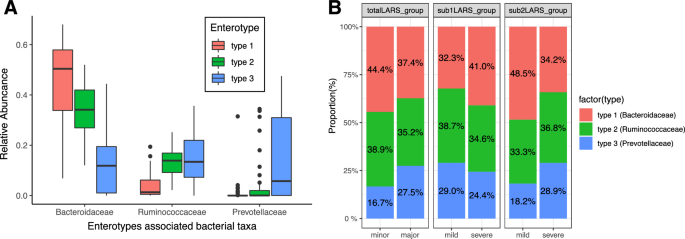
Enterotypes of gut microbiome according to severity and groups with low anterior resection syndrome (LARS). (A) Relative abundance of main contributing family-level taxa for three enterotypes of the gut microbiome. (B) Composition of three enterotypes among LARS groups. The values shown on the bar graph (B) represent the proportion of each enterotype in the column (levels) at the LARS group. The enterotype proportion at each column under each LARS group is shown as the percentage value in the bar graph. No significant difference in the enterotype composition between minor/mild and major/severe in each LARS group (Chi-squared test, P > 0.05).
Differentially abundant taxa between LARS groups
Twenty genera among a total of 123 genera showed a significant relationship (the absolute value of Spearman’s rank coefficient was above 0.2, nominal P < 0.05) to at least one variable among the LARS-associated continuous variables (Fig. 4).
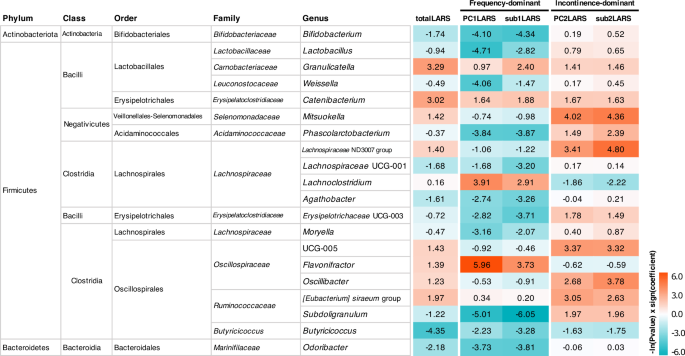
Heatmap of relationship between bacterial taxonomy and severity of low anterior resection syndrome (LARS) by LARS groups. Twenty taxa with any significant result (nominal P-value) corresponding to the severity of LARS are listed at the genus level. Log-transformed P values with sign of coefficient for each MaAsLin2 linear model are shown on the heatmap. Genera with zero in over 90% of samples were excluded for the analysis and a total of 123 genera were used. Each taxon with a positive relationship with LARS severity is marked red, while those with a negative relationship are marked blue.
As the totalLARS score increased, the abundance of Granulicatella (linear model coefficient β = 0.27; 95% CI, 0.02 to 0.52; P = 0.037) and Catenibacterium (β = 0.26; 95% CI, 0 to 0.51; P = 0.049) increased, and the abundance of Butyricicoccus (β = −0.55; 95% CI, −0.97 to −0.12; P = 0.013) decreased, and the direction of the relationship was consistent with other LARS-associated variables.
PC1LARS and sub1LARS or PC2LARS and sub2ALRS showed similar correlation patterns for each genus, whereas each distinct symptom groups, frequency-dominant vs. incontinence-dominant, differed significantly in the relationship with taxa. Main genera of lactic acid-producing bacteria, Bifidobacterium (β = −0.76; 95% CI, −1.37 to −0.15; P = 0.016 with PC1LARS and β = −0.79; 95% CI, −1.40 to −0.18; P = 0.013 with sub1LARS), Lactobacillus (β = −0.58; 95% CI, −1.00 to −0.15; P = 0.009 with PC1LARS and β = −0.42; 95% CI, −0.85 to 0.01; P = 0.060 with sub1LARS), and Weissella (β = −0.33; 95% CI, −0.60 to −0.06; P = 0.017 with PC1LARS) showed a significantly negative relationship with the severity of the frequency-dominant pattern, while showing a weak positive relationship with the severity of the incontinence-dominant patterns (PC2LARS and sub2LARS).
The differential abundance analysis with binary variables was performed. The abundance difference of Butyricicoccus in totalLARS_group (β = −1.34; 95% CI, −2.48 to −0.2; P = 0.023), Subdoligranulum in sub1LARS_group (β = −2.52; 95% CI, −4.07 to −0.96; P = 0.002), and Oscillibacter in sub2LARS_group (β = 1.74; 95% CI, 0.38 to 3.10; P = 0.014) was significant. The abundance of Lactobacillus (β = –1.28; 95% CI, −2.21 to −0.34; P = 0.009) and Bifidobacterium (β = −1.36; 95% CI, −2.73 to 0; P = 0.052) was lower in the severe sub1LARS_group than in the mild group (Fig. 5).
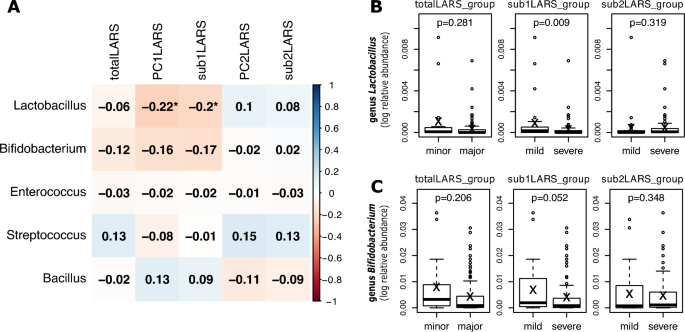
Abundancy differences of lactic acid-producing microbiome between low anterior resection syndrome (LARS) groups. (A) Spearman correlation between LARS severity in LARS groups and the relative abundance of microbiome (*P < 0.05). (B,C) Comparison of the relative abundance of genus Lactobacillus and Bifidobacterium in minor (mild) and major (severe) LARS groups (P values of MaAsLin2 linear model are shown).
Abundance of probiotic strains among LARS severity
Lactobacillus, Streptococcus, Enterococcus, Bacillus, and Bifidobacterium are used as probiotics38. PC1LARS and sub1LARS had a significant negative correlation with Lactobacillus [Spearman correlation coefficient [ρ] = −0.223, P = 0.020; ρ = −0.205, P = 0.033, respectively, Fig. 5a]. In sub1LARS_group, severe group showed statistically lower Lactobatillus (P = 0.009, Fig. 5b) and lower Bifidobacterium (P = 0.052, Fig. 5c).
