Solar energy amount on the building surface
The latitudes of the cities in different climate regions are 36.89° N (1st), 40.98° N (2st), 37.97° N (3st), and 39.91° N (4st Region). To decide the MMD values of the solar radiation, the typical day of each month was considered50. The buildings were deemed located in regions with mostly light-colored buildings.
Figure 3 shows the MMD solar radiation in different climate regions. The MMD extraterrestrial and global irradiation on the horizontal plane is shown in Fig. 3a,b. Global solar irradiation includes direct and diffuse irradiations on the horizontal plane and is measured by a pyranometer. These values are available in the literature62. The extraterrestrial solar radiation values are similar in the summer months as the difference regarding the Region gets more considerable in the winter months. The global solar radiation in different regions has more clear differences. The maximum value is observed in June. Figure 3c,d illustrates the direct and diffuse irradiations. The magnitudes of the natural solar radiation in the 1st and 2nd regions are similar. The lowest value is observed in the 4th Region. By considering the direct, diffuse, and global solar radiation, the heat flux on a perpendicular surface of the building can be decided. Figure 4 indicates the various regions’ MMD solar irradiation on the vertical surface. The magnitude of the solar heat flux in the summer months is observed as comparatively low since the sun rises higher in the sky, and the solar radiation strikes the ground at a higher angle compared to the winter months. However, the 1st Region has a more significant ambient temperature, the most extensive solar radiation in the 2nd Region. It is about the characteristic condition of the location. The annual average daily values were 3.96, 4.25, 3.63, and 3.36 kWh/m2 for the 1st, 2nd, 3rd, and 4th climate regions, respectively. These values were calculated for the typical days. Thus, annual values were obtained at 1447.5, 1554.4, 1327.95, and 1230 kWh/m2 for the 1st, 2nd, 3rd, and 4th regions. These values are far beyond the storage capacity of the PCM-impregnated wood fiber-based insulation material.
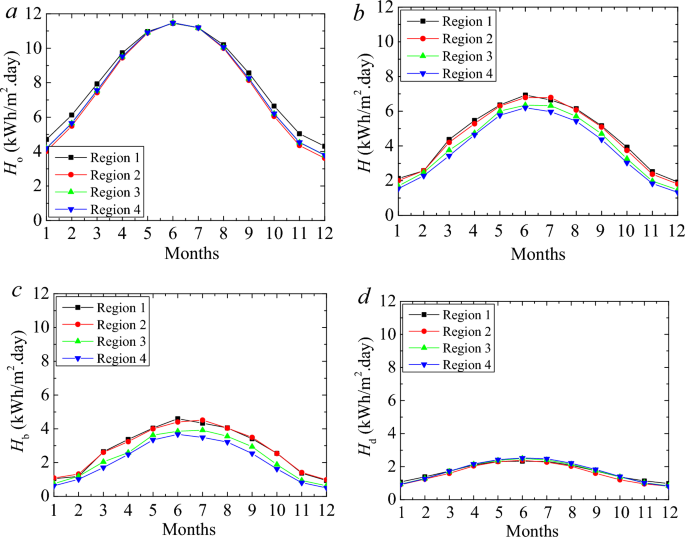
MMD global (a), extraterrestrial (b), direct (c), and diffuse (d) solar irradiation on the selected climate regions.
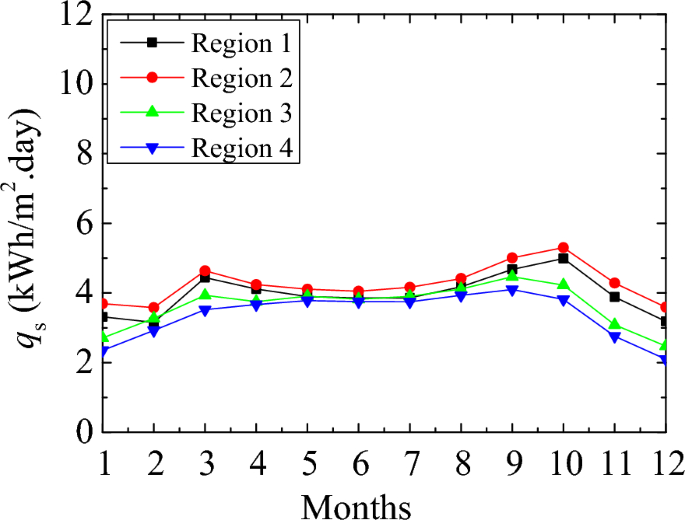
MMD solar irradiation on a perpendicular surface.
Effect of the PCM on energy saving
The solar energy analysis indicates that the energy-storing capability of PCM can be utilized at maximum capacity. The analytical calculation was carried out to evaluate the impact of the novel PCM materials on the building energy performance. PCM-impregnated wood fiber-based insulation material (PCM-INS) was considered for thermal insulation and energy storage. Five different PCM-impregnated insulation materials were applied to the building. The material was varied regarding the thermal storage capacity. The energy storage capacities of PCM-INS panels (0.05 m × 1 m2 × 1 m2) were calculated to be 60.1 kJ, 84.9 kJ, 108.1 kJ, 120.6 kJ, and 125.3 kJ for PCM1, PCM2, PCM3, PCM4, and PCM5. The sample building is a two-story building. The PCM-INS panels were considered for the walls, ceiling, and floors. The analysis was carried out using the total capacity of the PCM energy storage since solar radiation can provide sufficient energy for the selected location. Four different locations in different climate regions were chosen for evaluation. Figure 5 shows the annual energy saving per unit area of the structure as a function of the PCM-INS thickness.
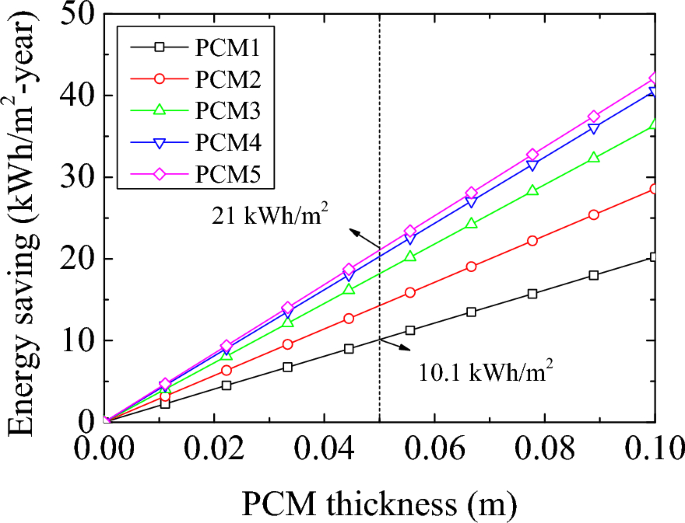
Annual energy saving for PCM1 (25 wt%), PCM2 (35 wt%), PCM3 (45 wt%), PCM4 (50 wt%) and PCM5 (52 wt%).
The thicknesses of PCM-INS varied between 0 and 0.1 m. The amount of energy storage is directly related to the amount of PCM in the wood fiber insulation material. The largest energy-saving capacity belongs to PCM5. It can provide an annual energy saving of 21 kWh/m2. It is followed by PCM4 (20.28 kWh/m2), PCM3 (18.18 kWh/m2), PCM2 (14.28 kWh/m2), and PCM1 (10.1 kWh/m2), respectively. The great content of the PCM provides outstanding thermal absorption. However, there is another issue that ought to be dealt with. The wood fiber has a thermal conductivity of 0.038 W/m2. The eutectic mixture SA-CA PCM has a thermal conductivity of 0.14 W/m2. PCM provides an advantage with the thermal energy storage characteristic, while PCM impregnation in the wood fiber reduces the thermal resistance of the insulation with growing thermal conductivity. It has an adverse effect the heat transfer. Therefore, it is required a comprehensive energy performance analysis. Thus, we can decide whether the PCM has an advantage on the building energy performance or is a thrashing.”
The structure’s total heat necessity was calculated regarding the thermal gains and losses of the building. The sample building was considered in four climate regions. The heat requirements of buildings in different regions drastically change regarding their environmental and climatic characteristics. Fourier’s law of conduction and Newton’s law of cooling calculated the conductive and convective heat losses through the wall, windows, ceiling, doors, and floor. Thermal loss through ventilation was also considered to decide the heat needed. Apart from the thermal storage of PCM, solar energy and interior heat gains were considered in the evaluation. The internal heat gains arise from the heat dissipation of the electrical devices and people in the building.
Figure 6 illustrates the annual heat requirements of six different buildings in four other climate regions. The INS case indicates a building using only insulation without PCM. The heat requirement range in the y-axis in the figures was set with the same to see the reduction in the heat requirements. Insulated buildings without PCM show different trends from the other buildings with PCM. The increment in the thickness reduces the heat requirement. However, the reduction in the heat requirement gradually diminishes and becomes even. Therefore, as seen in the figure, the increment of the insulation thickness (without PCM) becomes unnecessary after a certain thickness. In the 1st climate region, the difference in the curve trends becomes apparent with the increment in the thickness.
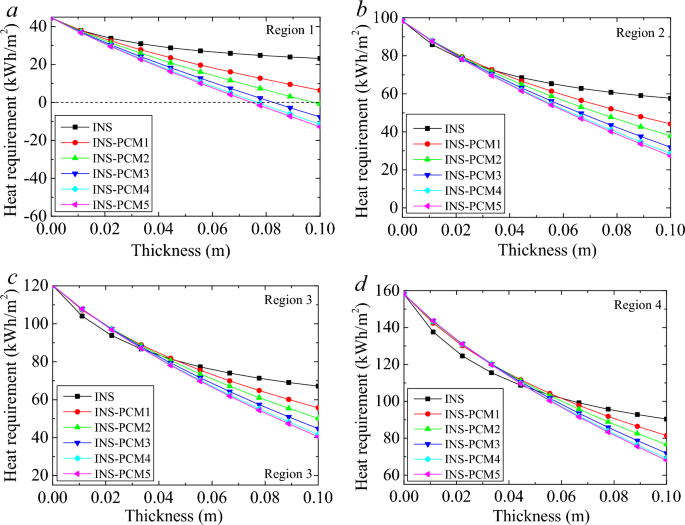
Annual heat requirement for the buildings with only INS and INS-PCMs in the different climate regions.
In Region 2, all cases show similar characteristics until 0.027 m thickness. The difference in the heat requirement between the INS and INS + PCMs gets more significant with an increment in the thickness. In the 3rd and 4th, the advancement of PCM appears after a specific thickness, and it varies according to the Region. The similarity in the amount of the heat requirement continues until 0.025 m in the 3rd Region. Until the thickness of about 0.035 m, INS shows a better performance than that of INS-PCMs. In a clear view, the INS case requires similar heat in the thickness of 0.035 m with PCM3, PCM4, and PCM5 cases, in the thickness of 0.041 m with PCM2, and in the thickness of 0.046 m with INS-PCM1 case. In other words, after these thicknesses, the benefit of the PCM becomes apparent. In the 4th Region, the thermal requirement of all INS-PCM is quite similar until the thickness of about 0.035 m. After that thickness, the difference becomes more apparent. The advantage of PCM appears in a larger thickness in the 4th Region. The heat requirement of the INS case is equal to that of INS-PCM4 and PCM5 cases for 0.048 m. The similarity appears for 0.05 m thickness in the case of INS-PCM3, for 0.054 m thickness in the case of INS-PCM2, and for 0.06 m in the case of INS-PCM1.
Similarly, the advantages of PCM appear after these specific thicknesses. As for the energy saving amount of INS case, the reduction of the heat requirement becomes about 21.41 kWh/m2 for the thickness variation between 0 and 0.1 m in the 1st climate region. In the case of PCM1, this reduction becomes about 38.2 kWh/m2. For the other INS-PCM cases, the maximum possible saving of 44.62 kWh/m2 can be attained for a thickness of 0.1 m. In the 2nd Region, the decrease in the thermal requirement for this thickness variation becomes about 40.7 kWh/m2 for INS and 71.1 kWh/m2 for PCM5. These reductions become 53.1 kWh/m2 (for INS) and 79.86 kWh/m2 (for PCM5) in the 3rd Region and 67.71 kWh/m2 (for INS) and 90.06 kWh/m2 (for PCM5) in the 4th Region. The difference in the heat requirement between the INS and INS-PCM5 becomes 23.2, 30.4, 26.72, and 22 kWh/m2 for the 1st, 2nd, 3rd, and 4th regions, respectively. These results are exciting. The most considerable reduction in the heat requirement occurs in the fourth Region. However, PCM can provide the most extensive advancement to INS in the 2nd climate region. 3rd, 1st, and 4th regions follow it. This interesting order arises from the fact that the PCM’s energy-storing capability is larger than the energy requirement of the building in the 1st Region. In the 1st Region, it is no need to enlarge the thickness after a certain value. The most attractive case occurs in the first Region due to the zero-energy building potential. As seen in Fig. 7a, the heat requirement drops below zero after a certain thickness. Namely, using the PCM, the heat requirement disappears in the first Region. It is about the low heat needed due to the warm climate characteristic of the Region. It is better to evaluate the annual saving in the Region. The annual saving rate was the ratio of energy saved to the heat required. Figure 7 shows the annual saving rate for all PCMs in the different climate regions. In the 1st Region, the heat requirement can be eliminated for the case of PCM5, PCM4, PCM3, and PCM2. In the case of PCM5, 100% energy saving can be achieved for the INS-PCM thickness of 0.074 m. PCM4 and PCM5 show quite close characteristics due to the relative amount of PCM contents. For PCM4, this thickness becomes 0.076 m. This full saving is achieved for a thickness of 0.083 m and 0.097 m for PCM3 and PCM2, respectively. The energy storage capacity of PCM1 needs to be increased to diminish the heat energy requirement in the 1st Region. On the other hand, it achieved a substantial energy saving of 72.2% for 0.1 m thickness of INS-PCM. The largest energy saving can be achieved for the INS-PCM5 case for all regions.
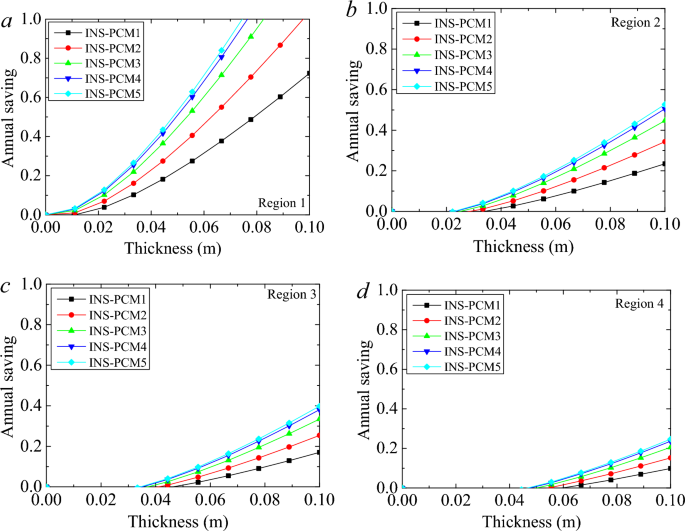
Annual saving rate for all PCMs in the different climate regions.
The effect of PCM appears in the thickness of 0.022 m in the 2nd Region. The saving reaches 52.7% for PCM5 for a thickness of 0.1 m. The PCM1, PCM2, PCM3, PCM4 can provide energy saving rates of 23.5%, 34.3%, 44.7% and 50.5%, respectively. The effect of the PCM appears in the thickness of 0.033 m in the 3rd Region. The saving rates reach 17%, 25.4%, 33.4%, 38% and 39.8% for PCM1, PCM2, PCM3, PCM4 and PCM5, respectively. In the 4th, the saving rate is lower compared to other regions. The effect of PCM becomes apparent for the 0.044 m INS-PCM thickness. The energy saving rates are 9.8%, 15.2%, 20.5%, 23.6%, and 24.7% for 0.1 m thickness in the cases of PCM1, PCM2, PCM3, PCM4, and PCM5, respectively. These comparatively low energy-saving rates are due to harsh winter conditions’ high thermal energy requirement. Even these comparatively lower rates are crucial and become significant for cumulative application. Although the lowest thermal resistance is seen in the case of PCM5, it still can provide the largest energy saving. The advantage of energy storage suppresses the adverse effect of the larger thermal conductivity of PCM5 in the 1st regions for all thicknesses and after a certain thickness in the 2nd, 3rd, and 4th regions. These thicknesses are seen in these figures. It may be better to concentrate on one PCM for the evaluation, and it is beyond argument that PCM5 shows the best performance to the other INS-PCMs.
Effect of the PCM on carbon emission
The building’s carbon emissions change depending on the fuel types. It is about the carbon content in the fuel. The complete combustion of the fuels with air was mentioned in the previous section. The amount of carbon emission was calculated to be about 2.7 kg-CO2/kg-fuel, 3.2 kg-CO2/kg-fuel, 2.64 kg-CO2/kg-fuel, and 3.35 kg-CO2/kg-fuel for the coal, fuel–oil, natural gas, and LPG, respectively.
The carbon emission of these fuels can be calculated utilizing the combustion reaction. Electricity generation also requires a thermodynamic process. The amount of carbon emission for electricity generation is directly related to the generation methods. Renewable or nuclear energy may diminish carbon emissions without considering the installment or production process of the power plants.
However, natural gas, coal, or fuel–oil-based power plants have an essential share in developing and developed countries. Therefore, assuming electricity as clean energy directly relates to the generation method. In Türkiye, about 37.2% of the electricity generation is obtained by coal-fired power plants. Coal has the largest share. It is followed by NG-fired thermal power plants, with 18.6% in fossil-fuel-based plants. A small percentage belongs to fuel oil with 0.24%. The rest of the generation is hydropower at 29.2%, wind energy at 7.15%, solar energy at 3.16%, geothermal energy at 2.94 and biofuels at 1.49%63. Türkiye and Egypt are developing countries with significant investments in renewable energy technology in the last decades64.
Therefore, the electricity generation share may change over the years. In this stage, the amount of carbon released for electricity generation can be decided by considering the quantity of the fuels to produce 1 kWh of electricity, the power generation rate for 1 kWh of electricity generation, and the amount of carbon in the fuel used to generate electricity. In the last case, the amount of carbon emission for electricity generation was calculated to be 0.434 kg-CO2/kWh. These amounts of carbon emission may be deceiving without considering the low heat values of the fuels. INS and INS + PCM5 cases were considered to investigate the quantity of carbon emissions. Figure 8 illustrates the carbon emission of these two cases for different climate regions and various fuels. As seen in the figure, PCM impregnation can significantly reduce carbon emissions. The effect of the insulation on the carbon emission is mostly clear until a certain insulation thickness. After that, the increment in the insulation thickness becomes ineffective.
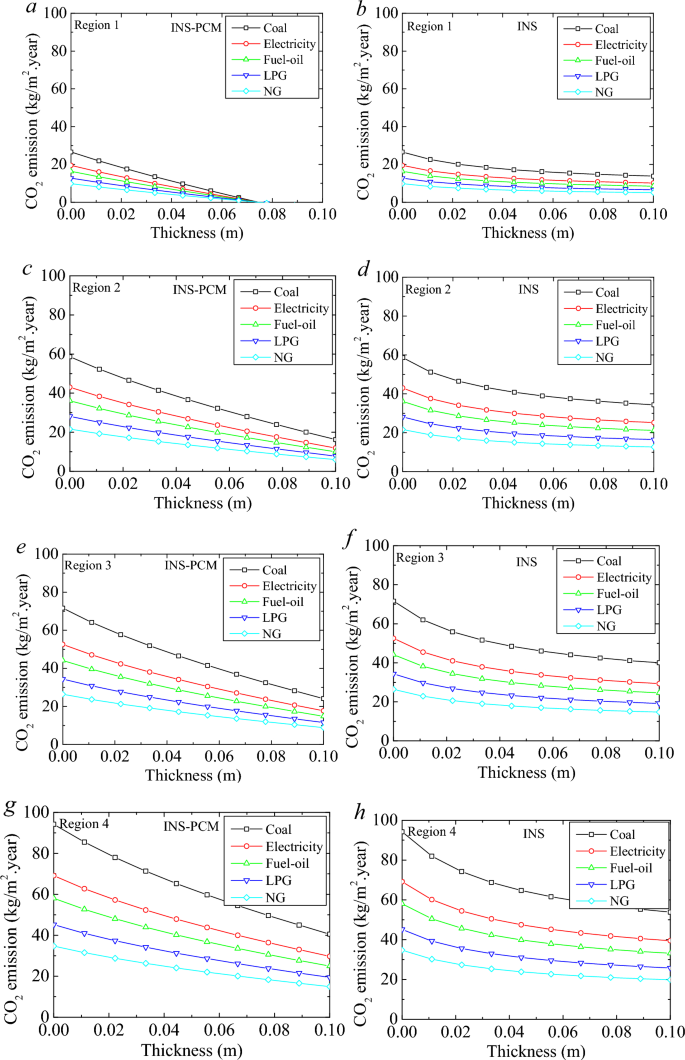
CO2 emission for selected fuels in the four climate regions for PCM5.
In the 1st Region, the carbon emission reduction of the coal-using building becomes 12.75 kg per m2 building usage area for the increment of insulation from 0 to 0.1 m without PCM. The PCM-impregnated insulation can provide a 26.58 kg reduction in carbon emission for 0.074 m thickness. It means all carbon emissions from heating purposes can be eliminated for this thickness. For the first Region, considering 0.074 m thickness can give a better comparison. The reduction becomes 11.6 kg for 0.074 m thickness in the case of insulation without PCM. The amount of carbon reduction varies depending on the fuels. In the case of electricity, the reduction becomes 8.5 kg and 19.5 kg-CO2/m2 for INS and INS-PCM5 cases, respectively. The PCM can provide an 11 kg larger reduction. In the 2nd Region, the reduction of carbon emission enlarges. The decrease in coal becomes 24.25 kg and 42.36 kg-CO2/m2 for INS and INS-PCM5 cases, respectively. The PCM provides about 18.1 kg-CO2/m2 more reduction for coal. The advantages of INS-PCM5 compared to the INS become 13.3 kg, 11.1 kg, 8.7 kg, and 6.67 kg-CO2/m2 for electricity, fuel–oil, LPG, and natural gas cases. In the 3rd Region, the reduction for coal becomes 31.6 kg and 47.5 kg-CO2/m2 for INS and INS-PCM5 cases. The decrease in carbon emission enlarges for the 3rd Region compared to the 1st and 2nd regions. However, the advancement of PCM in CO2 emission reduction gradually decreases for a higher region number. For the case of coal, the improvement becomes 15.9 kg-CO2/m2 in the 3rd Region. It becomes 13.3 kg, 11.1 kg, 8.7 kg, and 6.67 kg-CO2/m2 for electricity, fuel–oil, LPG, and natural gas cases. The most considerable reduction in carbon emission and the lowest advancement of PCM compared to the sole insulation case is observed in the 4th Region. The reductions become 40.37 kg and 53.68 kg-CO2/m2 for INS and INS-PCM5 cases.
The advancement becomes 13.3 kg, 9.77 kg, 8.2 kg, 6.4 kg, and 4.9 kg-CO2/m2, respectively. The most significant improvement occurs in the case of coal, electricity, fuel oil, LPG, and natural gas, respectively. It is related to the amount of carbon emission. Coal causes the most significant carbon emission. The carbon emission of electricity depends on the source of the generation method. In conclusion, the PCM becomes the most efficacious in the case of the 1st Region, then the 2nd, 3rd, and 4th regions, respectively. In any case, PCM can provide a significant benefit in reducing carbon emissions.
Effect of the PCM on cost saving
The effect of PCM on energy and carbon emission decrease was evaluated by adapting PCM-impregnated wood fiber-based insulation material on the building wall. The buildings were considered to use numerous fuels in four climate regions. Energy and carbon emission saving are vital issues. However, an investment can be reasonable when it is cost-effective to utilize. Individual utilizers are one of the most important shareholders of the energy-saving strategy for sustainability. The cost-saving rate changes regarding the price of the energy source. This study considered coal, electricity, fuel oil, LPG, and natural gas, and their current prices were used to decide the cost saving. The price averages of the fuels were 0.25 $/Nm3, 0.13 $/kg, 0.096 $/kWh, 0.46 $/kg, 0.95 $/kg for natural gas, coal, electricity, fuel oil, and LPG, respectively, in Türkiye and Egypt. Figure 9 shows various regions’ annual heating costs per unit area. INS and INS-PCM5 using buildings were considered for the evaluation. The figure illustrates the annual price of the heating without considering the PCM price. The figures show that the PCM can provide the most apparent advantage in the 1st Region. Insulation is the most effective and significant part of the energy-saving goal. However, increments in the thickness never eliminate the energy loss but reduce heat transfer. The annual cost becomes straight after a certain increment of the insulation thickness. Namely, its effect on cost-saving performance becomes insignificant and unnecessary. However, PCM can provide a direct advantage due to its energy storage feature. A larger thickness of the INS-PCM means larger energy storage and lower energy need. The largest heating price belongs to electricity. LPG follows it. It is about the amount of energy needed and the price. Therefore, the major cost saving arises in the electricity case. The annual heating cost is eliminated for the INS-PCM5 thickness of 0.074 m. For this thickness, the heating cost for coal decreases by 0.56 $ and 1.28 $/m2.year for INS and INS-PCM5 cases. These reductions become about 1.89 $ and 4.32 $/m2.year for electricity. INS-PCM5 can provide about 2.28 times larger energy saving for all fuels. In the 1st Region, INS-PCM5 provides 0.72 $ (for coal), 2.43 $ (for electricity), 1.3 $ (for fuel–oil), 2.03 $ (for LPG), and 0.52 $/m2.year saving (for natural gas) compared to INS (Fig. 10). In the 2nd, 3rd, and 4th regions, the advantages appear after a certain thickness; these thicknesses are 0.022 m, 0.033 m, and 0.044 m, respectively. INS-PCM5 can provide about 1.74-, 1.5-, and 1.33 times larger energy saving than INS in the 2nd, 3rd, and 4th regions for all fuels. In the 2nd Region, the savings become 0.87 $ (for coal), 2.94 $ (for electricity), 1.59 $ (for fuel–oil), 2.46 $ (for LPG), and 0.63 $/m2 per year (for natural gas) (Fig. 10). These become 0.76 $, 2.59 $, 1.4 $, 2.16 $, and 0.55 $/m2. year in the 3rd region and 0.64 $, 2.16 $, 1.71 $, 1.8 $, and 0.46 $/m2. year in the 4th region, respectively. In the 2nd Region, the savings become larger than in the 1st Region. On the other hand, the amount of savings is reduced in the 3rd and 4th Regions. Although a larger energy saving was achieved in the 2nd Region, using PCM in the first Region is preferable due to zero energy building potential and less INS-PCM thickness. The amount of cost savings enlarge for a building with larger usage areas.
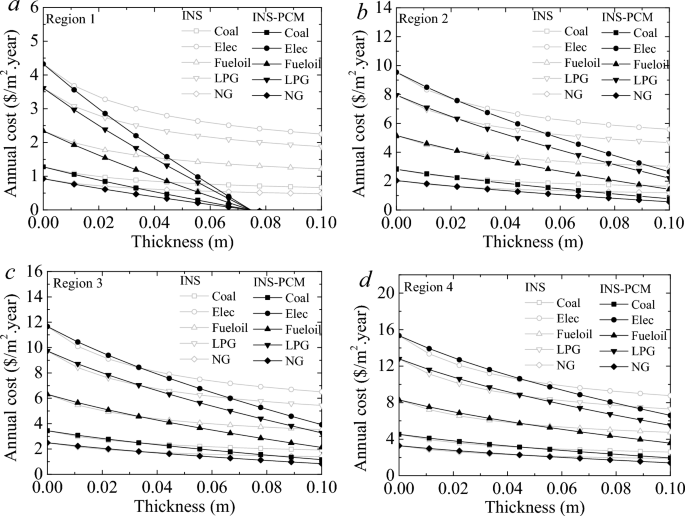
Annual cost of heating for all fuels in four climate regions.
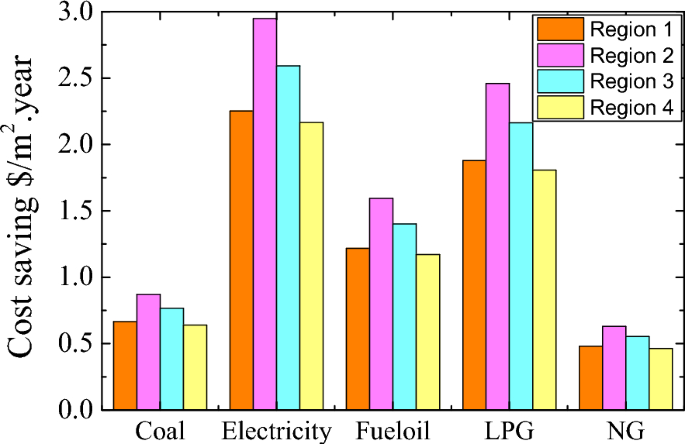
Annual cost saving of INS-PCM5 compared to INS for all fuels in four climate regions.
Stearic and capric acid prices could be high for a laboratory-scale application. However, the cost of the PCM can be significantly reduced for bulk purchase of the acids. Thus, the investment becomes highly conceivable. For the payback period evaluation, the bulk purchase of the acids was considered. Figure 11 shows the payback period of the phase change materials (0.1 m) for various fuels. The increment in the thickness of INS-PCM provides a more significant amount of PCM impregnation, and this larger PCM can provide more energy storage. INS-PCM5 requires a more extended payback period than the other PCM cases.
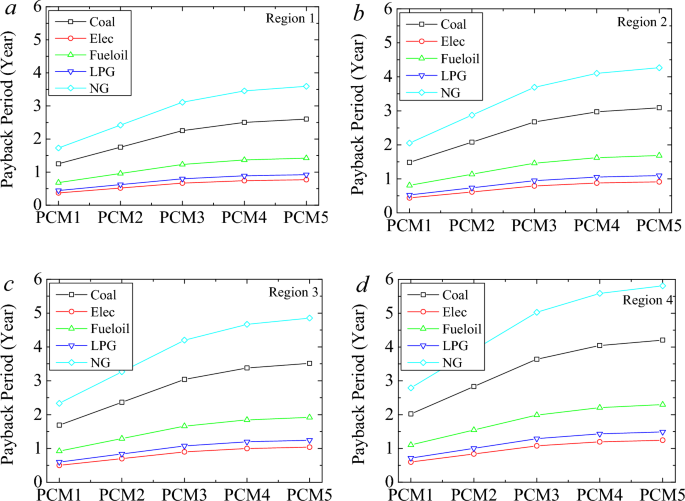
Payback period of the phase change materials (0.1 m) for various fuels.
On the other hand, it also can provide a larger annual energy and cost savings. The shortest payback period is observed in the building using electric heating. The payback period varies from 0.37 to 1.24 years PCM1 case in the 1st Region and PCM5 case in the 4th Region, respectively, for the electricity case. After that, the building using LPG for heating can provide the second shortest payback period. It varies between 0.44 and 1.48 years for LPG for PCM1-Region1 and PCM5 Region 4. The most extended payback period is observed for the case of natural gas. It varies between 1.72 and 5.8 years for the same issues.
The coal case follows it and varies between 1.25 and 4.2 years. The longest and shortest payback period becomes 0.37–5.81 years regarding the fuel and Region.
