Thermal analysis
In general, TGA is frequently employed to determine the decomposition of the polymers at various temperatures and the thermal stability of the materials respectively33. Defined as the temperature that corresponded to the weight equal to 5%, the initial degradation temperature (IDT) was employed as a thermal stability indicator for the developed coatings. Furthermore, Fig. 2 illustrates the TGA curves for the acrylic-epoxy (90:10 wt.%) polymer coating along with the GO based polymer nanocomposite coating samples for heating temperature ranging from 30 to 900 °C. Furthermore, roughly 1% of mass loss was observed at the 1st stage at 100 °C and below and this occurrence was due to the loss of moisture in the mixing of different ratios of the resin-based coating. In addition, in the 2nd stage, after 200 °C, the degradation and decomposition of the molecular networks of the acrylic-epoxy polymer coating was indicated by the TGA curve, whereby the thermal deterioration of the polymer coating had occurred in a single stage. Moreover, approximately between 280 and 450 °C, the curve indicated the genuine degradation zone of the polymer coating, which was due the breakdown of the linear carbon–carbon chains and the polymer’s crosslinked network respectively34,35. Additionally, it was observed that the evaporation of the moisture had resulted in the weight loss, which occurred between 80 and 100 °C. On the other hand, the carbonization of the residual polymer coating sample resulted in the weight loss at temperature exceeding 450 °C36. As mentioned previously, a one-step reduction that was exhibited by the acrylic-epoxy polymer coating confirmed its stability without further aggregation. It is also noteworthy to mention that at the point of inflexion from 220 to 300 °C, the smaller loss in acrylic resin percentage resulted the mass reduction to take place at a slower rate, however, the loss of mass was observed to occur at a faster rate at temperatures ranging between 320 and 450 °C respectively. Similarly, these findings were in complete agreement with the literatures which reported that the inclusion of epoxy resin had significantly reduced the degradation rate of the acrylic resin, whereas, the inclusion of large amount of mixture component into the epoxy network had resulted in the enhancement at the initial stage of the polymer decomposition37. In the recent years, PDMS has been reported to have good thermal and adhesion properties, however, its mechanical properties are comparatively weak. Furthermore, it was reported that in order to improve the mechanical properties of the PDMS, it was essential to blend the PDMS with various polymers and nanofillers38. Depending on the component amounts, it was previously demonstrated that the blended polymer exhibited various properties such as mechanical, thermal and chemical properties respectively38. The addition of PDMS with other resins has shown promising improvements in structural, morphological, thermal and mechanical properties. In this work, it is understood that the cross-linking network formation of the blends due to the functional groups available in acrylic and epoxy (C–O, C=O, OH) and PDMS (Si–O–Si) would play an important role in the enhancement of the thermal properties of the coatings developed. As depicted in Table 2, the acrylic-epoxy polymer coating had exhibited an IDT value of 293.23 °C. Moreover, the temperature where 50% weight loss occurred and the residue yields along with the IDT values for all the coatings were tabulated together, as shown in Table 2. A two-step decomposition had occurred for all the investigated coating samples. Here, it was clearly observed that the decomposition stages of the polymer matrix made up of acrylic and epoxy resins were not affected by the presence of PDMS and GO nanofillers respectively. Furthermore, the TGA curves suggested that the thermal stability of the polymer coatings was significantly enhanced with the addition of GO nanoparticles. In fact, due to the presence of the strong intermolecular force, the addition of GO nanoparticles into the polymer matrix increased the stability of the coating39. Firstly, from 0 to 310 °C, it was observed that the weight loss for all coating samples occurred due to the release of physiosorbed water molecules and the removal of the oxygen-containing functional groups which existed on the GO sheets40. This phenomenon further confirmed its hydrophilic nature. In addition, from the temperature region of 310–500 °C, the phenomena of the weight loss were due to the decomposition of the C–C bond skeleton of the GO41,42. Moreover, it was observed that all the coating samples did not exhibit any significant weight loss in the range of 500–900 °C. Interestingly, a residual yield in the range between 2 to 5% was obtained for all the GO coating samples at 700 °C, thus, indicating that a small part of the GO was burned into the volatile gases mostly at high temperature. Alternatively, Boiubed et al. investigated the thermal stability of neat GO coating composite sample40. Here, the TGA results for neat GO revealed three weight loss steps, whereby the weight loss occurred at 0–125 °C (1st step), 125–310 °C (2nd step) and 310–550 °C (3rd step) temperature regions respectively. Also, 16% of residual weight was observed for the neat GO sample at 700 °C, which revealed that most part of the GO was burned at high temperature. In other words, in this analysis, it can be clearly concluded that the chemical reaction of the blended resins and PDMS with the oxygen containing groups that existed on the GO surface enhanced their decomposition temperature and prevented the carbon skeleton from decomposition. Hence, GO inclusions into the polymer matrix is advantageous to enhance the thermal stability due to the equal dispersion and strong interfacial adhesion of the coatings, whereby it acted as a barrier to delay the decomposition of the blended resins.
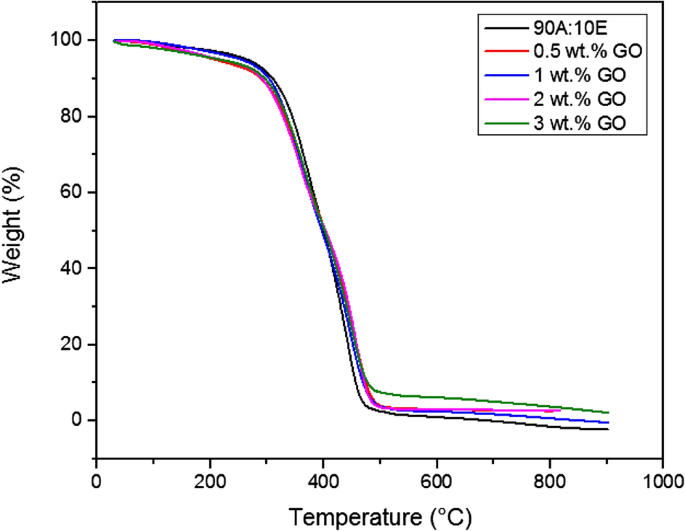
TGA curves of the acrylic-epoxy (90:10 wt.%) polymer coating along with the GO based nanocomposite coating samples that
was fabricated under the influence of vacuum respectively.
On the other hand, as depicted in Table 2, there was clear evidence that the recorded IDT values exhibited an increasing trend when more GO nanoparticles were employed within the hybrid polymer matrix. Similarly, when comparing 0.5% G and 1% G respectively, the temperature at 50% weight loss was observed to slightly decrease from 401.76 to 396.92 °C, and then it increased up to 401.95 °C as the GO content increased up to 3%, thus maintaining the temperature. Here, it can be concluded that thermal stability of the nanocomposite coatings had improved and did not have any significant degradation. Furthermore, it was previously reported by other researchers that agglomeration within the polymer matrix resulted in a decrease in the thermal stability of the coatings43,44. Despite experiencing agglomeration particularly for samples with higher GO loadings, the results indicated that these coatings did not exhibit a reduction in the thermal stability. Additionally, this exhibited results further indicated that the GO resulted in the enhancement of the physical barrier effect of the hybrid coatings (Fig. 2). To support this finding, Sharif et al. investigated on the thermal properties of the modified GO and PDMS nanocomposite coatings45. Here, it was revealed the inclusion of GO nanoparticles have enhanced the thermal and mechanical properties of the PDMS compared to using neat GO45. Moreover, as mentioned above, it was confirmed that the stronger interactions between the GO surface functional groups and the PDMS resulted in a lower mobility of the binder chains, thus, decreasing the rate of degradation of the samples which would have further enhanced the cross-linking density and hence resulting in the enhancement of the thermal properties45. In addition, the slow degradation of the polymer chains that was absorbed at the matrix filler interface could possibly result in the significant enhancement of the coating’s thermal stability. Interestingly, it was also revealed that the residual mass at 700 °C increased from 2.742 to 4.664% with the increment of the GO nanoparticles (0.5–3%) respectively. In short, the tortuous path effect provided by the presence of GO nanofillers within the polymer matrix resulted in the enhancement of the thermal stability of the coatings, hence delaying the escape of the volatile degradation products and the permeation of oxygen and char formation respectively. Similarly, these findings involving the incorporation of GO into other various types of polymers (e.g., polyurethane, epoxy etc.) were also found to be in accordance with the results reported by the researchers13,39,40.
Degree of transparency
UV–vis transmittance distribution is an essential property for each hybrid coating sample and this distribution was measured in the visible wavelength range of 200–800 nm, as depicted in Fig. 3. In addition, due to its extraordinary optical features, the graphene nanoparticles have the capability to tune the optical properties of the composite coating. In the past decade, it was reported that 2.3% of incident light was absorbed by a single layer of graphene in extremely broadband range46. In addition, the incorporation of this remarkable feature into graphene-based composite materials is still lacking in research as only several works have been previously published up to date. For instance, Wang et al. investigated the optical transmittance spectra by depositing GO sheets onto the polymer substrate47. Here, the graphene thin film, composed of GO sheets, with a thickness of 10 nm exhibited an optical transmittance of approximately 70%. For instance, graphene/GO film with a thickness of 10 nm has exhibited an optical transmittance of 70.7% at a wavelength of 1000 nm, whereas, as the film thickness decreases, this resulted the optical transmittance to significantly improve (> 80%)47. Moreover, Bao et al. demonstrated that by just employing 0.7 wt.% of graphene in pristine polymer, a tenfold rise of the optical absorption of a composite was observed in an ultraviolet-near infrared (UV-NIR) range48. In other words, the tunability of optical properties plays a vital role for progress in the application development, however, there is a lack of literature in relation to the optical transmission/absorption of graphene-based composite materials since it has only been investigated in visible or NIR range. Hence, significant efforts are required to systematically investigate the influence of GO content on these properties. In this approach, the optical properties of GO-based coatings with variable concentrations (0.5–3 wt.% GO) in PDMS polymeric matrix were investigated. Furthermore, it was clearly observed that the lowest content of GO (0.5 wt.%) was sufficient to totally block the incoming irradiation. By referring to Table 1 and Fig. 1 respectively, it can be seen that the coating thickness for all samples was reported to be high, in the range between 123 to 477 µm. Therefore, it was expected that optical transmittance to be extremely low, as illustrated in Fig. 3. Alternatively, Qi Wang et al. investigated the optical transmittance of the PDMS based microcrystalline graphite powder composites samples having different concentrations of graphite powder (0.15%, 0.25% and 0.42%) within the 300–1000 nm wavelength range49. The results were compared with sample containing pure PDMS. Here, it was observed that the pure PDMS sample exhibited 90% transmittance, however, the sample containing the highest content of graphite powder (0.42%) exhibited the lowest transmittance close to zero percent49. In other words, by incorporating higher content of graphene and GO nanoparticles, the thickness of the coating/film will increase, thus, resulting the optical transmittance to be extremely low (approaching zero percent). Furthermore, in another study, Zeranska-Chudek et al. reported similar trends at 0.5 wt.% graphene loading, whereby the drop of transmittance reached a saturation point, in this case zero percent transmittance, where no light was transmitted by this coating sample, thus, making it completely opaque in the range between 200 to 800 nm50. In addition, it was further demonstrated that the samples containing the lowest graphene content (< 0.02 wt.%) were almost fully transparent, however, as the content of graphene increased to 1.5 wt.%, the composite totally blocked the visible light50. Intuitively, the addition of graphene/GO nanoparticles into the polymer matrix lowered the transparency almost evenly, without changing the shape of the spectra. Hence, all the coating samples exhibited similar feature to single or multi-layered GO composite coating sample in the UV-IR range. In short, due to the relatively high thickness of the coating samples and with the increment of GO addition into the polymer matrix, this resulted the optical transmittance to be unmeasurable.
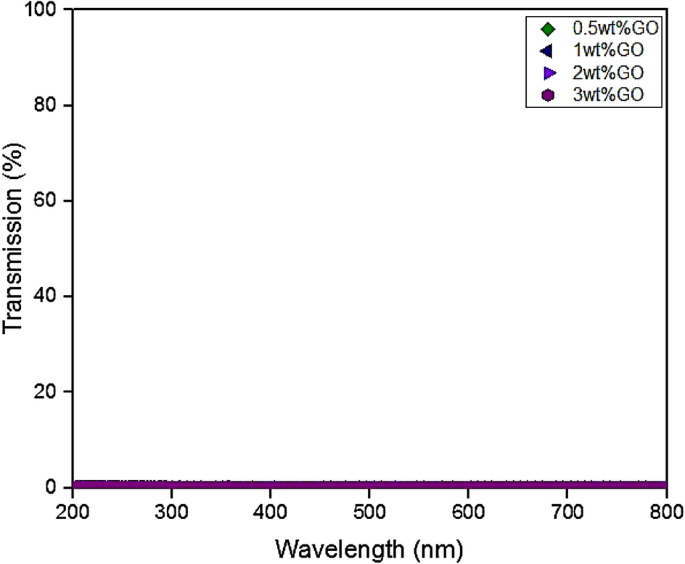
UV transparency curves for the GO based hybrid coating samples fabricated under the influence of vacuum.
WCA measurement
WCA measurements were carried out to investigate the hydrophobic attributes and the surface wettability of the fabricated coatings. Furthermore, it was revealed that acrylic resins had a good barrier property and were able to slow down the corrosion process with a CA of 74.3°51. Alternatively, Kocijan et al. demonstrated that the epoxy coating had exhibited a WCA of 75°52. However, it was also reported that a CA of approximately 65.1° was exhibited by an unfilled epoxy coating53. Here, it was indicated that both acrylic and epoxy coatings were hydrophilic in nature. Furthermore, to achieve an improved hydrophobic solid surface, Jiang et al. and Wang et al. demonstrated two main factors that are needed to be considered54,55. Firstly, the chemical composition played an essential role to enhance the surface hydrophobicity. For instance, the incorporation of the PDMS into the polymeric matrix further increased the CA of the coating. Secondly, the enhancement in hydrophobicity of the coating can be directly inferred with an increase in the CA after incorporating GO nanoparticles. Here, compared to micron size particles, the addition of graphene and graphene-based nanoparticles as nanofillers in the polymeric matrix greatly enhanced the surface roughness of the coating due to their higher specific surface area and smaller particle size56.
Therefore, in this evaluation, the WCA results for all the hybrid coatings containing PDMS and different GO content were included along with the addition of PDMS as a modifier of the resins to highlight the enhancement of the coating surface wettability towards greater hydrophobicity. Illustrated in Figs. 4 and 5 respectively are the recorded WCA values (degrees) and the obtained WCA surface characterizations for all the hybrid nanocomposite coating samples. In addition, it was observed that the GO inclusion into the polymer resins had enhanced the WCA up to 88°, close to hydrophobicity. On the other hand, as mentioned above, the surface wettability of the fabricated GOTF was previously investigated6,29,30. Here, it was reported that the GOTF exhibited a WCA of 50° and it did not degrade over 25 days, hence, exhibiting good resistance against UV degradation. To support these findings, it was reported that due to the presence of epoxy, carboxyl, and hydroxyl groups in the GO, invariably, the GO can possibly exhibit a CA up to 67.4°, thus, confirming the nature of hydrophilicity15,57,58. Alternatively, Xu et al. mentioned that the GO under typical treatment displayed hydrophilic properties, exhibiting a CA of approximately between 30° to 60°59.
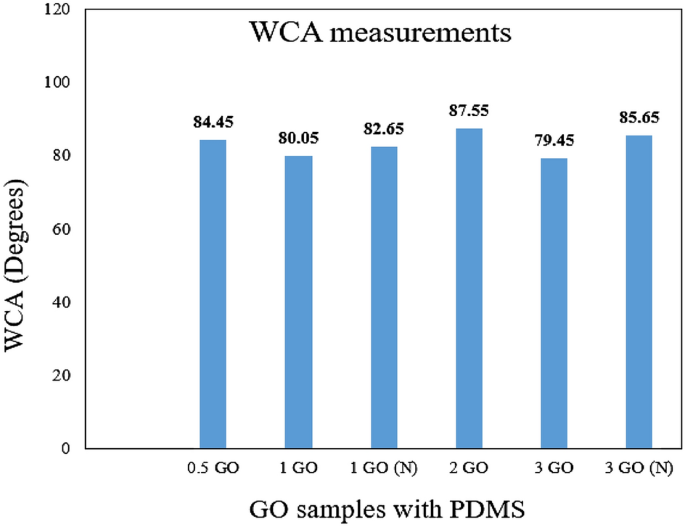
WCA values (degrees) for all the coating samples.
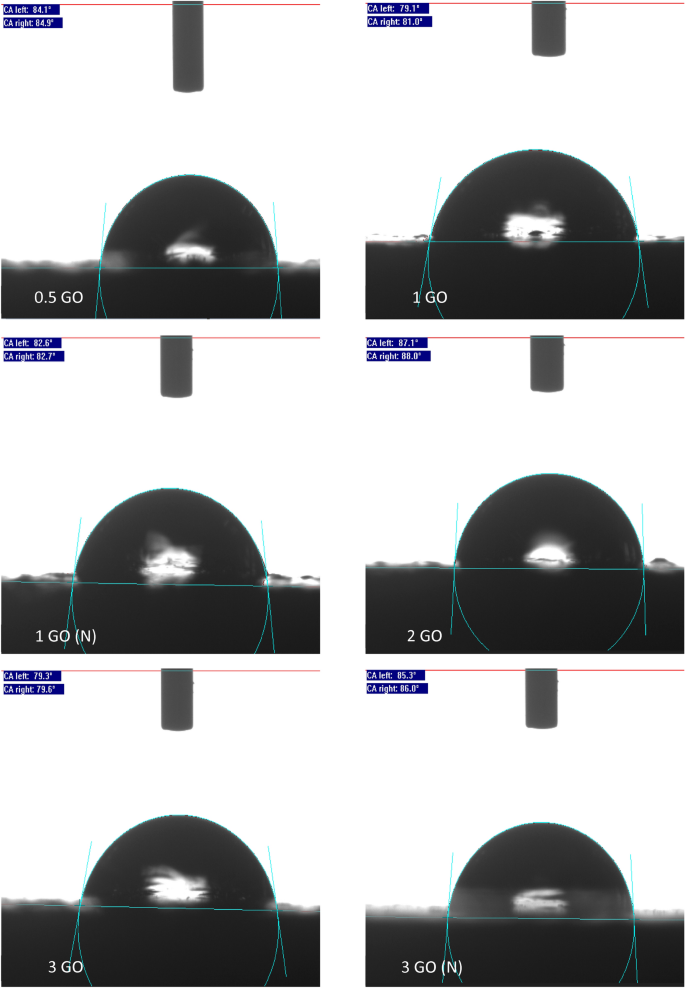
The representations of the WCA surface characterization for all the samples.
Furthermore, it was observed that the GO fabricated without the influence of vacuum displayed a lower WCA, for instance, the 1% GO and 3% GO exhibited a WCA of 80.05° and 79.45° respectively. This was due to the presence of the large GO nanoparticles embedded within the polymeric matrix and resulted in agglomeration during the blending process. For instance, Ohigara et al. revealed that the hydrophobicity of the coating exhibited a downward trend particularly when the agglomeration of the nanoparticles increased60. Additionally, at higher concentrations, Chen et al. reported that the nanoparticles had the tendency agglomerate61. Here, it was demonstrated that for each coating system, there was a specific concentration of the GO that can be considered to be the optimum concentration, at which the surface morphology of the resulted surfaces can be significantly affected by the incorporated nanoparticles. In other words, exceeding this critical concentration resulted the GO to accumulate more at the bottom instead of the surface area of the coating film, thus, resulting the bulk properties to be affected more compared to the surface properties61. In this study, similar trends were observed when higher concentrations of GO were added (> 2 wt.%), which resulted the CA values to slightly decrease.
Also, Ogihara et al. stated that a low surface energy and high surface roughness resulted in a hydrophobic surface60. Here, it was also demonstrated that when a droplet of water was settled on a rough surface, the droplet was in contact with both the constituent materials and the air trapped within the rough surface. Hence, due to air being an absolutely hydrophobic material, this resulted to an enhancement in the surface hydrophobicity60. Here, compared to the other GO samples that was fabricated without the presence of vacuum, the 0.5%, 1%, 2% and 3% GO samples revealed a higher WCA of approximately 84.45°, 82.65°, 87.55° and 85.65° respectively. The optimum enhancement was exhibited by the 2% GO sample which exhibited the highest WCA value of 87.55°. In short, the addition of GO into the polymer matrix had remarkably improved the surface hydrophobicity, whereby GO loadings up to 2% was appropriate due to the optimum dispersion.
Coating surface adhesion analysis
When developing anti-corrosion coating samples, another essential property that mandatory to be analysed was the coating layer adhesion to the pre-treated substrate surface62,63. Moreover, shown in Fig. 6a–f are the adhesion behaviours of all the GO-based nanocomposite coating samples on the steel substrate. Figure 6a and b illustrated the surface adhesion image of 0.5% GO and 1% GO coating system respectively which exhibited no loss of adhesion, whereby all the edges of the cuts were smooth, which indicated excellent adhesion of the blended resins to the pre-treated steel substrate. Therefore, these coating systems were classified as 5B grade. Furthermore, similar observation which further confirmed that the inclusion of 1wt.% of GO nanoparticles into the polymeric matrix exhibited no effects on the superior adhesion properties of the blended polymer resins. Here, the surface of the 1% GO (N) and 2% GO sample was also rated as 5B grade, as illustrated in Fig. 6c. However, as illustrated in Fig. 6e–f, the 3% GO and 3% GO (N) coating samples were classified as 4B respectively due to the presence of the detached flakes at the intersections of the cut (< 5%). In short, the addition of GO into the polymer coatings exhibited no significant effect on the coating/substate adhesion whereby no peelings were observed in all coating systems53. The coating adhesion can be possibly decreased due to the presence of water at the metal/coating interface, thus, resulting the corrosion rate to accelerate on the metal substrate64. In other words, poor adhesion permits the corrosive ions to accumulate at the coating/metal interface, thus, triggering the degradation process to occur. Therefore, this surface adhesion analysis highlighted that the interphase adhesion of the coating was significantly improved with the incorporation of higher acrylic resin (host binder) compared to epoxy coating due to its good flowability. In short, it has been revealed that all the GO-based nanocomposite coating systems exhibited excellent adhesion behaviour of the coatings, receiving 5B and 4B ratings according to the ASTM standard.
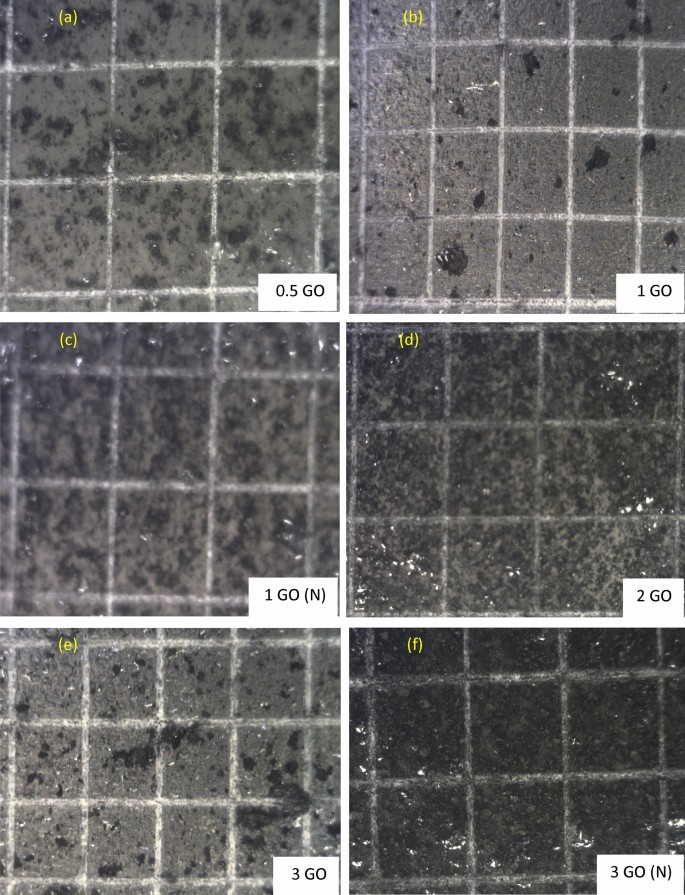
Representations of the CHT analysis performed on (a) 0.5 wt.% GO, (b) 1 wt.% GO, (c) 1 wt.% GO (N), (d) 2 wt.% GO, (e) 3 wt.% GO and (f) 3 wt.% GO (N) based nanocomposite coating samples.
Surface morphology (FESEM)
The employment of different GO concentrations into the polymer matrix was conducted via the solution intercalation method. Based on this concept, the surface morphology of the resulted coatings had differed, whereby the incorporation of a higher amount of GO resulted to agglomeration. Hence, the dispersion of the nanoparticles in the polymeric matrix were affected65,66. In this approach, the FESEM was employed to clarify the surface morphology differences between the GO nanoparticles and the blended polymer resins. Illustrated in Fig. 7 are the micrographs of the prepared hybrid GO-based nanocomposite coating samples. Figure 7a–f represented the GO samples that were fabricated with and without the influence of vacuum respectively. Furthermore, as depicted in Fig. 7a, c and d respectively, there was clear evidence that the uniform dispersion of GO nanoparticles in the polymeric matrix had occurred, thus, indicating the efficiency of the sonication process to fabricate an acceptable dispersion level of GO-based nanocomposite coatings. On the other hand, it was observed that the agglomeration had increased with the increment of the GO nanoparticles, which was due to the increase in the number of nanoparticles in the unit area. The most noticeable effect was observed with the highest loading ratio (3%), as shown in Fig. 7f. Moreover, Fig. 7b and e further proved that larger GO nanoparticles were present within the polymeric matrix (highlighted in green). In order words, this phenomenon had increased the ability of the nanoparticles to attract each other, thus, resulting in the formation of relatively larger agglomerated nanoparticles. Similar findings on the agglomeration of nanoparticles with higher loadings were previously reported in these literatures which resulted the coating surface to have a hydrophilic attribute6,40,61,67. Last but not the least, the lateral dimensions of the highest loading rates (3 wt.%) of GO nanoparticles will be discussed and compared between the GO fabrication with and without the influence of vacuum. Figure 8a and b illustrates the lateral dimensions of the 3 wt.% GO and 3 wt.% GO (N) coating sample respectively. In addition, it was previously reported that the GO nanoparticles generally exhibited a diameter of approximately 1.2 nm68. Moreover, depending on the synthesis and post synthesis processes (e.g., sonication etc.), the lateral size of the GO nanoparticles can vary between tens to hundreds of micrometers (µm). Previously, Yang et al. investigated the dimensions of the GO nanoparticles via atomic force microscopy (AFM)69. Here, it was observed that the GO nanoparticles exhibited a thickness of approximately 1.1 nm and a lateral size ranging from 500 to 50 µm69. Recently, Rhazouani et al. reported that the AFM profiling showed that the GO nanoparticles had thickness of 1.5–2.5 nm and lateral dimensions of 1–1.5 µm respectively68. From Fig. 8a, the lateral dimensions of the 3 wt.% GO nanoparticles were observed to range between 2.553 and 2.926 µm, while, Fig. 8b illustrated that the 3 wt.% GO (N) nanoparticles exhibited a much lower lateral dimensions, ranging between 2.223 and 2.361 µm respectively. The differences in the lateral dimensions clearly revealed the significance of the influence of vacuum during the GO synthesis process. In other words, the 3 wt.% GO (N) sample that was fabricated under the influence of vacuum had resulted in smaller nanoparticle size. It is also noteworthy to mention that a lower loading rates of GO nanoparticles (0.5–2 wt.%), the lateral dimensions of the GO nanoparticles is expected to be much lower compared to the 3 wt.% GO sample. Hence, the results exhibited in Fig. 8a and b were in complete agreement with the previous reported literatures as well as the results reported in this investigation68,69. Therefore, it was confirmed that higher loading rates of GO nanoparticles and the fabrication of GO without the influence of vacuum had resulted in larger size nanoparticles, thus leading to agglomeration and lowering the corrosion protection performance. Overall, 0.5% GO, 1% GO and 2% GO revealed the best surface morphology in terms of being evenly dispersed/distributed, no cracks or holes, no obvious agglomeration, thus, confirming the good adhesion properties of the coating.
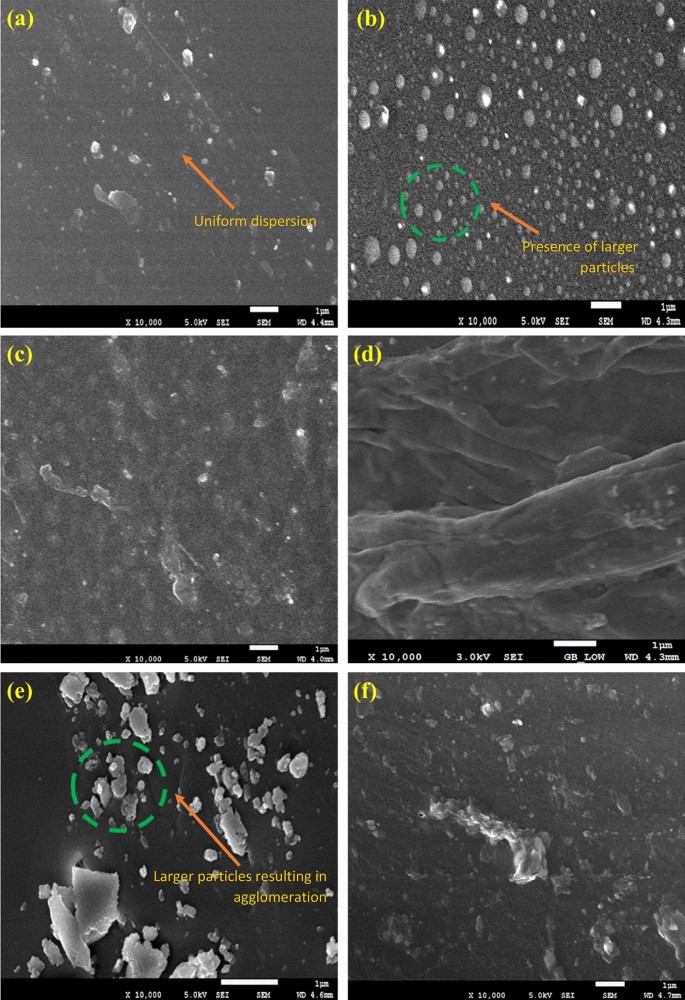
FESEM representations of the fracture surface of (a) 0.5 wt.% GO, (b) 1 wt.% GO, (c) 1 wt.% GO (N), (d) 2 wt.% GO, (e) 3 wt.% GO and (f) 3 wt.% GO (N) based hybrid polymer nanocomposites coatings respectively.
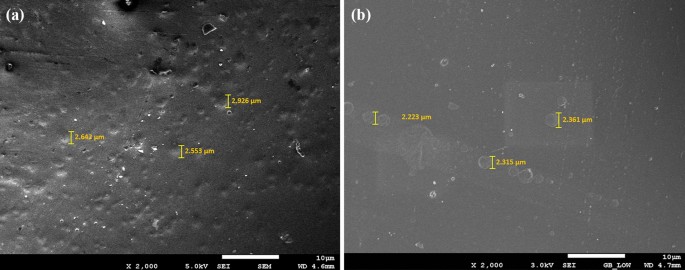
FESEM micrographs distinguishes the lateral dimensions of (a) 3 wt.% GO and (b) 3 wt.% GO (N) respectively.
