Viral loads in the upper airways are highly variable during acute infection with SARS-CoV-2
A total of 37 patients with acute COVID-19 were recruited into this study between May and December 2020 (Fig. 1a). All participants had mild symptoms that did not require hospitalization (Table 1)18. Twenty-five of these patients were recruited within the first week of symptom onset (median = 5 days, interquartile range [IQR] = 4–6 days). Upper airways viral loads (UA-VLs) were highly variable during the first week of infection (median = 1.7 × 10⁸ RNA copies/ml, range = 1.7 × 10² to 9.8 × 10¹⁰ RNA copies/ml) (Fig. 1b). IgA and IgG responses against the viral S protein were below the detection threshold in all cases (Supplementary Fig. 1), and only 12% of donors (3/25) had detectable neutralization titers at the time of recruitment (Fig. 1c). In the second week of infection, all patients had lower UA-VLs (median = 2.1 × 10³ RNA copies/ml, range = 4.8 × 100 to 1.1 × 10⁷ RNA copies/ml) (Fig. 1b), and SARS-CoV-2 neutralization titers became detectable in 92% of cases (23/25), subsequently peaking during the third week of infection (median IC50 = 165, IQR = 66–375) (Fig. 1c). Most subjects retained detectable neutralization titers until the last study visit 6 months after symptom onset (Fig. 1c). A similar pattern was observed for antibody responses against the viral NC protein (Supplementary Fig. 1).
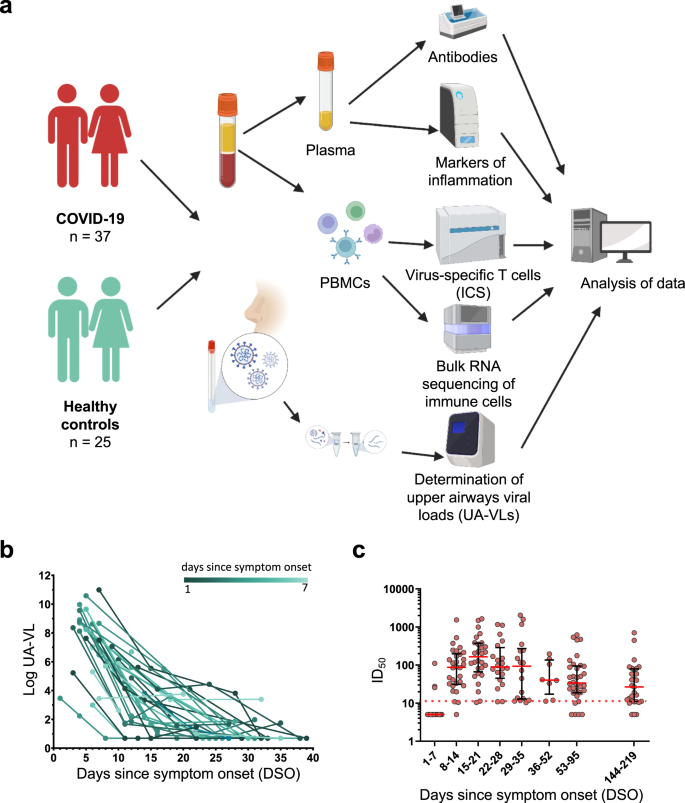
a Schematic representation of the study design. Donors were sampled weekly for 1 month and then periodically until 6 months after initial presentation. b Longitudinal quantification of upper airways viral loads (UA-VLs) in patients with mild COVID-19 (n = 25) recruited during the first week after symptom onset. Each line represents one donor. The green scale stratifies patients according to days since symptom onset at presentation. c Pseudovirus neutralization titers (ID50) plotted versus days since symptom onset (DSO). Each dot represents one donor at one time point as follows: 0–7 DSO, n = 25; 8–14 DSO, n = 30; 15–21 DSO, n = 28; 22–28 DSO, n = 20; 29–35 DSO, n = 18; 36–52 DSO, n = 8; 53–95 DSO, n = 34; 144–219 DSO, n = 29. The cutoff is indicated by the dotted red line. Serum samples that did not achieve 50% neutralization (ID50 < 10) were assigned a value halfway below the lower limit of quantification (ID50 = 5). Data are shown as median ± IQR. Source data are provided as a source data file. Figure 1a was created with Biorender (publication licence number GL254AMU2N).
Collectively, these data established that UA-VLs peaked during the first week of infection, before the emergence of detectable antibody responses, and varied considerably among individuals with mild COVID-19.
Nucleocapsid-specific T cell responses correlate inversely with upper airways viral loads during acute infection with SARS-CoV-2
T cell responses against the viral NC and S proteins were measured longitudinally using flow cytometry to detect the intracellular production of IFN-γ. SARS-CoV-2-specific CD4+ T cells were detected more frequently than SARS-CoV-2-specific CD8+ T cells (Fig. 2a–e and Supplementary Fig. 2). Area under the curve (AUC) analyses revealed that the overall frequency of SARS-CoV-2-specific CD4+ T cells was higher than the overall frequency of SARS-CoV-2-specific CD8+ T cells per day across all time points in the study (P < 0.0001) (Fig. 2f), and in both lineages, the overall frequency of NC-specific T cells was higher than the overall frequency of S-specific T cells per day across all time points in the study (P = 0.0102) (Fig. 2g). Higher frequencies of NC-specific CD4+ T cells and S-specific CD8+ T cells were detected in patients versus healthy controls during the first week after symptom onset (P = 0.0005 for NC, P = 0.0085 for S) (Fig. 2h, i). SARS-CoV-2-specific CD4+ T cell responses typically peaked during the third week after symptom onset for NC (median = 0.045% of CD4+ T cells, P = 0.0018) and S (median = 0.023% of CD4+ T cells, P = 0.0063), whereas SARS-CoV-2-specific CD8+ T cell responses typically peaked during the fourth week after symptom onset for NC (median = 0.024% of CD8+ T cells, P = 0.042) and during the third week after symptom onset for S (median = 0.033% of CD8+ T cells, P = 0.038) (Fig. 2h, i). Of note, 51.1% of patients mounted detectable SARS-CoV-2-specific CD4+ T cell responses during the first week of infection, and 37.7% of patients mounted detectable SARS-CoV-2-specific CD8+ T cell responses during the first week of infection (Fig. 2e).
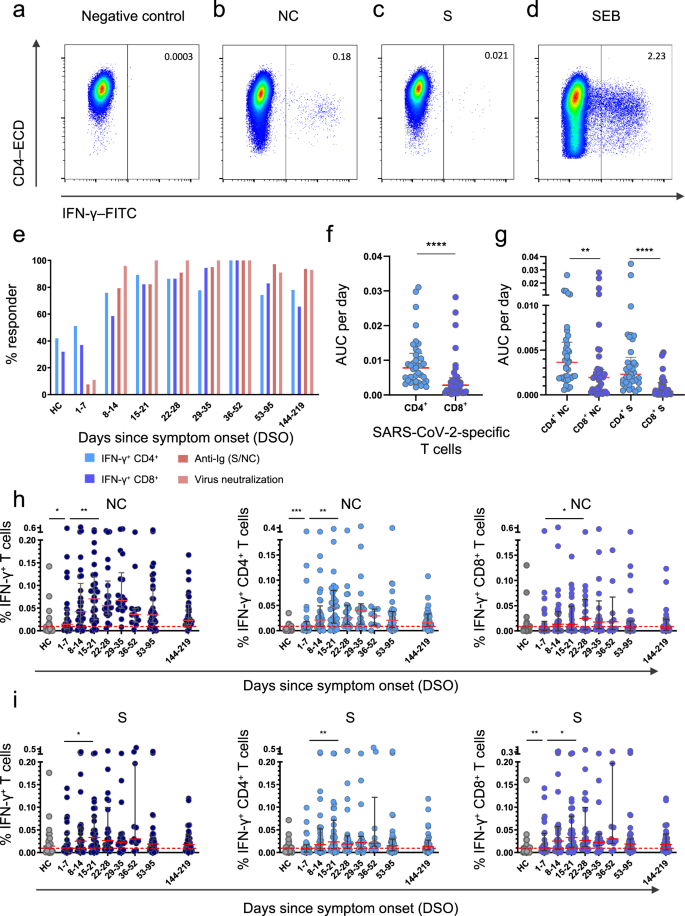
a–d Representative flow cytometry plots showing the identification of IFN-γ+ CD4+ T cells in the absence of stimulation (a) or in the presence of overlapping nucleocapsid (NC) peptides (b), overlapping spike (S) peptides (c), or staphylococcal enterotoxin B (SEB) as the positive control (d). Plots are gated on CD3. Numbers indicate the percent frequency of CD4+ T cells that produced IFN-γ. e Responder frequencies for IFN-γ+ CD4+ and IFN-γ+ CD8+ T cells specific for NC or S, antibody titers against NC or S, and antibody-mediated neutralization of SARS-CoV-2 (HC, healthy control). f, g Area under the curve (AUC) per day comparisons of the overall magnitude of SARS-CoV-2-specific CD4+ versus CD8+ T cells (f) and the overall magnitude of SARS-CoV-2-specific CD4+ versus CD8+ T cells broken down by target protein (NC versus S). Each dot represents one donor. h Frequencies of all NC-specific T cells (left), NC-specific CD4+ T cells (middle), and NC-specific CD8+ T cells (right). Each dot represents one donor. The cutoff is indicated by the dotted red line. i Frequencies of all S-specific T cells (left), S-specific CD4+ T cells (middle), and S-specific CD8+ T cells (right). Each dot represents one donor. The cutoff is indicated by the dotted red line. Data are shown as median ± IQR (f, g, h, i). Sample sizes in (e, h, i): HC, n = 24; 1–7 DSO, n = 25; 8–14 DSO, n = 30; 15–21 DSO, n = 28; 22–28 DSO, n = 20; 29–35 DSO, n = 18; 36–52 DSO, n = 8; 53–95 DSO, n = 34; 144–219 DSO, n = 29. Sample size in (f, g): n = 37. P values in (f): ****P < 0.0001; (g): ***P = 0.0005, ****P < 0.0001; (h): NC-specific IFN-γ+ T cells: *P = 0.017, **P = 0.0032; NC-specific IFN-γ+ CD4+ T cells: **P = 0.0018, ***P = 0.0005; NC-specific IFN-γ+ CD8+ T cells: *P = 0.042; (i): S-specific IFN-γ+ T cells: *P = 0.038; S-specific IFN-γ+ CD4+ T cells: **P = 0.0063; S-specific IFN-γ+ CD8+ T cells: *P = 0.038, **P = 0.0085 (Mann–Whitney U test or Wilcoxon signed rank test, two-sided). Source data are provided as a source data file.
In total, 21% of healthy controls had detectable NC-specific T cell responses, and 52% of healthy controls had detectable S-specific T cell responses (Fig. 2h, i), consistent with previous reports9,19,20,21. To investigate this phenomenon, we measured serological reactivity against the four common cold coronaviruses (CCCVs). Strain-specific antibody responses were detected in most patients for NL63 (80%), OC43 (64%), and HKU1 (68%), whereas only 48% of patients were seropositive for 229E (Supplementary Fig. 3a). Data from healthy controls are shown in Supplementary Fig. 3b. There was no association between the presence of early NC-specific CD4+ or CD8+ T cell responses and serological reactivity against CCCVs (Supplementary Fig. 3c).
In further analyses, we found a strong inverse correlation between the overall frequency of circulating NC-specific T cells during the first week after symptom onset and UA-VLs (r = −0.75, P < 0.0001) (Fig. 3a). This association was strongest for NC-specific CD4+ T cells (r = −0.69, P < 0.0001) but was also significant for NC-specific CD8+ T cells (r = −0.45, P = 0.02) (Fig. 3a). In contrast, we found no such correlations for S-specific T cells, irrespective of lineage (Fig. 3b). Using a censored linear mixed effects model with random individual effects to control for other potential confounders, we also found that incremental increases in the frequencies of NC-specific but not S-specific CD4+ and CD8+ T cells reduced individual UA-VLs (Supplementary Fig. 4). Age and gender did not play a significant role. Importantly, the model also controlled for time after symptom onset in the regression analysis, ensuring the results were independent of any natural decay in the UA-VLs.
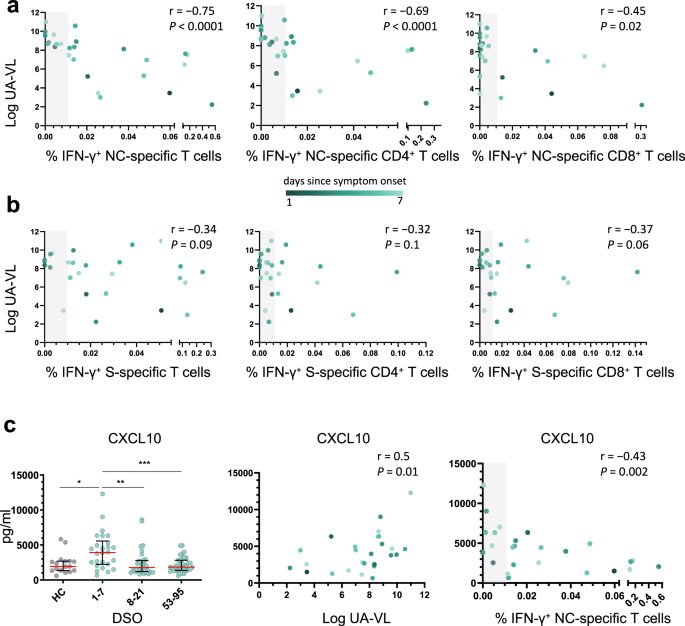
a, b Spearman rank correlations showing upper airways viral loads (UA-VLs) versus the frequencies of all NC-specific T cells (left), NC-specific CD4+ T cells (middle), or NC-specific CD8+ T cells (right) (a, n = 25) and the frequencies of all S-specific T cells (left), S-specific CD4+ T cells (middle), or S-specific CD8+ T cells (right) (b, n = 25) during the first week after symptom onset. c Left: plasma concentrations of CXCL10 are shown for healthy controls (HCs, n = 17) and longitudinally for patients according to the number of days since symptom onset (1–7 DSO, n = 25; 8–21 DSO, n = 32; 53–95 DSO, n = 35). *P = 0.01, **P = 0.003, ***P = 0.0007 (Mann–Whitney U test, two-sided). The green scale stratifies patients according to days since symptom onset at presentation. Data are shown as median ± IQR. Middle and right: Spearman rank correlations showing plasma concentrations of CXCL10 during the first week after symptom onset versus UA-VLs (middle) and the frequencies of all NC-specific T cells (right). The gray bar indicates non-responders (right). Source data are provided as a source data file.
Collectively, these findings supported a role for early IFN-γ-expressing NC-specific CD4+ and CD8+ T cells as mediators of viral clearance in the upper airways, which could have important implications for the development of more effective vaccines against SARS-CoV-2.
Nucleocapsid-specific T cell responses correlate inversely with markers of systemic inflammation during acute infection with SARS-CoV-2
Excessive production of various chemokines and cytokines, including CXCL10 and CXCL11, has been linked with the severity of COVID-1922,23. Using a 26-plex panel, we found that plasma concentrations of CXCL10 and CXCL11 were significantly elevated during the first week after symptom onset (median = 3922 pg/ml and 97.5 pg/ml, respectively) compared with later time points (P < 0.001 or P < 0.0001) (Fig. 3c and Supplementary Fig. 5). Moreover, plasma concentrations of CXCL10 correlated directly with UA-VLs (r = 0.50, P = 0.01) and inversely with the frequency of circulating NC-specific T cells during the first week after symptom onset (r = −0.43, P = 0.002) (Fig. 3c). Similar correlations were found for CXCL11 (r = 0.65, P = 0.0004 versus UA-VLs; r = −0.43, P = 0.03 versus NC-specific T cells) (Supplementary Fig. 5). Other soluble factors were also upregulated significantly during the first week after symptom onset compared with later time points, including CCL3, CCL19, galectin-9, and MICA (Supplementary Fig. 5). Plasma concentrations of CCL2, CCL19, galectin-9, and MICA correlated directly with UA-VLs during the first week after symptom onset (r > 0.4, P < 0.05), and plasma concentrations of CCL19 and MICA correlated inversely with the frequency of circulating NC-specific T cells during the first week after symptom onset (r < −0.4, P < 0.05) (Supplementary Fig. 5).
To explore the nature of these associations, we profiled the transcriptomes of circulating immune cell subsets, namely CD4+ T cells, CD8+ T cells, monocytes, and NK cells, isolated during the first week after symptom onset (n = 14 patients with mild COVID-19). We initially focused our analysis on previously reported differentially expressed genes (DEGs), notably STAT1, OAS1, and EIF2AK2, which have been implicated in the clearance of SARS-CoV-1 by murine IFN-γ+ NC-specific CD4+ T cells after intranasal vaccination12. In our cohort, the frequency of circulating NC-specific CD4+ T cells correlated inversely with gene expression among circulating immune cell subsets for STAT1 (CD4+ T cells: r = −0.38, P = 0.029; CD8+ T cells: r = −0.53, P = 0.001; monocytes: r = −0.34, P = 0.05; NK cells: r = −0.39, P = 0.023), OAS1 (CD4+ T cells: r = −0.21, P = 0.25; CD8+ T cells: r = −0.47, P = 0.006; monocytes: r = −0.60, P = 0.0002; NK cells: r = −0.5, P = 0.003), and EIF2AK2 (CD4+ T cells: r = −0.42, P = 0.015; CD8+ T cells: r = −0.23, P = 0.199; monocytes: r = −0.51, P = 0.003; NK cells: r = −0.43, P = 0.012) (Fig. 4a). Similar correlation trends were observed among the same immune cell subsets for NC-specific CD8+ T cells, and direct correlations were detected for all three markers versus UA-VLs (Fig. 4a).
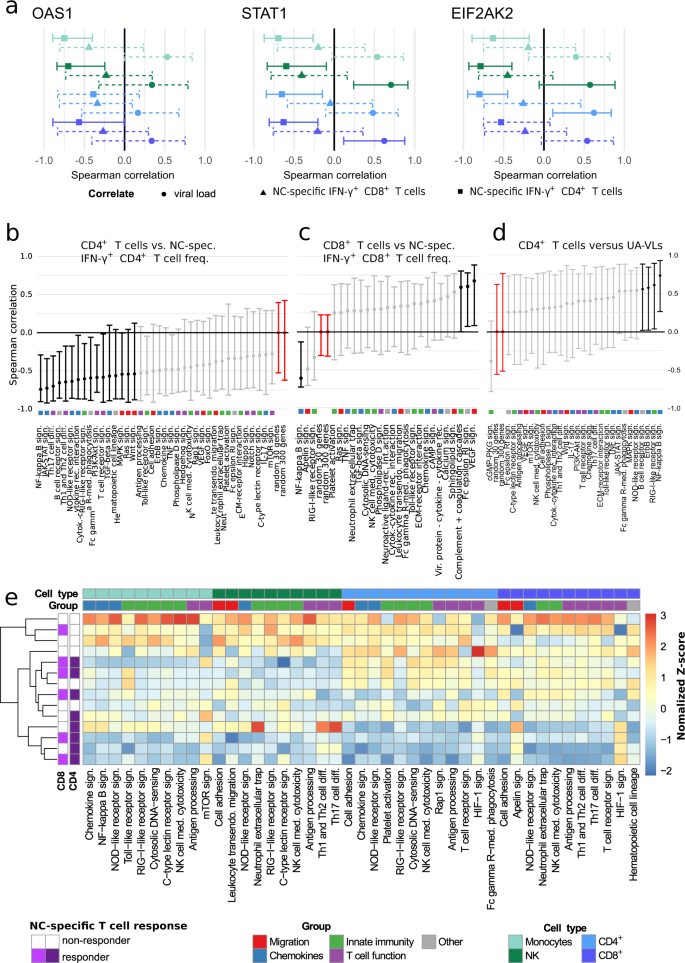
RNA sequencing data were obtained from circulating CD4+ T cells (light blue), CD8+ T cells (dark blue), monocytes (light green), and NK cells (dark green) isolated during the first week after symptom onset (n = 14 patients with mild COVID-19). a Spearman rank correlations showing mean expression scores for OAS1 (left), STAT1 (middle), and EIF2AK2 (right) versus NC-specific IFN-γ+ CD4+ (squares) and NC-specific IFN-γ+ CD8+ T cell frequencies (triangles) and upper airways viral loads (circles, UA-VLs). Whiskers show 95% confidence intervals calculated using bootstrapping with replacement using sample numbers equal to the original dataset. Solid lines indicate significance. Dashed lines indicate correlation results below the threshold for significance. b–d Spearman rank correlations showing mean pathway gene expression scores for CD4+ T cells versus NC-specific IFN-γ+ CD4+ T cell frequencies (b), CD8+ T cells versus NC-specific IFN-γ+ CD8+ T cell frequencies (c), and monocytes versus UA-VLs. Whiskers as in (a). Data are shown as r values with 95% confidence intervals. Black and light grey lines indicate significant and non-significant associations, respectively. Red lines indicate reference control r values derived from 30 or 300 random genes as shown. Colored squares indicate the pathway group (manual annotation). e Spearman rank correlations for all KEGG pathways in the categories Signal Transduction, Signaling Molecules and Interaction, Immune System, and Cell Growth and Death. Data are shown as z-normalized mean pathway expression scores. Patients were clustered by expression profile similarity. Pathways are shown for cell subsets with significant enrichment scores in patients versus healthy controls (top row, P < 0.05; exact P values are provided in Supplementary Tables 1–4). Source data are provided as a source data file.
Next, we conducted mean expression analyses for pathways classified as Signal Transduction, Signaling Molecules and Interaction, Immune System, and Cell Growth and Death according to the Kyoto Encyclopedia of Genes and Genomes (KEGG). Correlations were performed against the frequency of circulating NC-specific CD4+ T cells (Fig. 4b), the frequency of circulating NC-specific CD8+ T cells (Fig. 4c), and UA-VLs (Fig. 4d). Signaling pathways involved in the host response and inflammation, including those for NF-κB, RIG-1-like receptors (RLRs), and JAK-STAT, generally correlated inversely with the frequency of NC-specific CD4+ T cells and directly with UA-VLs (Fig. 4b, d). The frequency of circulating NC-specific CD8+ T cells also correlated inversely with the NF-κB pathway but directly with other pathways, including those associated with cytotoxicity (Fig. 4c). The pathway scores were then included in the censored linear mixed effect model for further investigation. These analyses confirmed that the pathway scores for NF-κB and RLR signaling, as well as other pathways, including antigen processing and presentation, for at least one of the immune cell subsets in each case were influenced by UA-VLs (Supplementary Fig. 6).
Unsupervised analyses further revealed three distinct clusters within the overall dataset (Fig. 4e). One group incorporating NC-specific CD4+ T cell responders was characterized predominantly by downregulation of immune system and signaling pathways among circulating immune cell subsets, whereas another cluster incorporating NC-specific CD4+ T cell non-responders was characterized predominantly by upregulation of immune system and signaling pathways among circulating immune cell subsets (Fig. 4e). The other cluster incorporated a mixed group of NC-specific CD4+ T cell responders and non-responders, in which immune system and signaling pathways among circulating immune cell subsets were either upregulated, predominantly among T cells, or downregulated, predominantly among monocytes and NK cells (Fig. 4e).
Collectively, these data showed that systemic upregulation of inflammatory pathways during early infection was positively associated with high viral burdens in the upper airways and negatively associated with the frequencies of circulating NC-specific CD4+ and CD8+ T cells, which in turn suggested that these immune effectors likely mitigated the inflammatory response via enhanced clearance of SARS-CoV-2.
T cells in the upper airways express mRNAs encoding IFN-γ and cytotoxic effector molecules during acute infection with SARS-CoV-2
To pursue this line of investigation, which suggested a potential role for tissue-recirculating and/or tissue-resident NC-specific CD4+ and/or CD8+ T cells as mediators of viral control at the site of infection12, we interrogated two single-cell RNA sequencing datasets available in the public domain. The primary dataset communicated by Ziegler et al. incorporated nasopharyngeal material collected from patients in intensive care with no recent history of COVID-19 (n = 6) and patients with mild to severe COVID-19 (n = 37)24. A total of 32,587 cells were analyzed in the original study and annotated to 32 clusters spanning distinct identities across the epithelial barrier and the immune system. The secondary dataset communicated by Yoshida et al. was filtered for acutely infected adults for whom nasal swab data were available and comprised 14 patients with mild to severe COVID-19 (ncells = 49,185)25.
In the T cell cluster from the primary dataset, the most abundantly expressed transcripts among patients with COVID-19 were those derived from IFNG (ndonors = 20, fcells = 31%), followed by TNF (ndonors = 20, fcells = 16%), FASLG (ndonors = 18, fcells = 13%), CD40LG (ndonors = 12, fcells = 3%), and, less frequently, IL2, IL10, and IL21 (Supplementary Fig. 7). Transcripts encoding cytotoxic effector molecules were also detected, including PRF1 (ndonors = 22, fcells = 27%), GZMA (ndonors = 18, fcells = 30%), and GZMB (ndonors = 19, fcells = 30%) (Supplementary Fig. 7). A comparable pattern was detected in the secondary dataset, although fewer cells expressed IFNG mRNA (11%). All relevant data obtained from T cells originally located in the infected upper airways epithelium are provided in Supplementary Dataset 7.
Collectively, these analyses showed that genes encoding cytotoxic and other effector molecules, including IFN-γ, were expressed frequently among T cells isolated from the upper airways of patients with mild to severe COVID-19.
T cell expression of mRNA encoding IFN-γ in the upper airways is linked with antigen presentation and viral control during acute infection with SARS-CoV-2
In line with these findings, a previous study reported that acutely infected nasopharyngeal tissue harbored T cells expressing IFNG mRNA, likely reflecting specificity for SARS-CoV-226. We therefore identified responders (Ziegler, n = 18; Yoshida, n = 10) and non-responders (Ziegler, n = 16; Yoshida, n = 4) among patients with mild to severe COVID-19, defined as those with or without IFNG mRNA+ T cells, respectively. Further interrogation of the primary dataset segregated by responder status revealed that 16 of the 32 initially annotated cell subsets contained DEGs (Padj. < 0.05, absolute logfold change [LFC] > 0.25). The highest numbers of upregulated DEGs were present in developing and FOXJ1high ciliated cells (n = 352 for both) (Supplementary Dataset 1), which are abundant in the nasopharynx and frequent targets of SARS-CoV-224. In responders, these cells overexpressed master transcription factors involved in antiviral immunity, such as STAT1 and IRF1, and genes associated with antigen processing and presentation, such as HLA-A, HLA-B, HLA-C, HLA-E, and TAP1 (Fig. 5a). Many of these genes are regulated by IRF1. Multiple HLA class 1 and class II genes were also upregulated among ciliated cells from responders in the secondary dataset, alongside STAT1 and TAP1 (Fig. 5b and Supplementary Dataset 4). In addition, ciliated cells from responders overexpressed several proteasome subunits in both datasets, and other less abundant target cell types in the upper airways displayed similar patterns of gene expression. Consequently, genes associated with antigen processing and presentation were significantly enriched among ciliated cells from responders across multiple gene ontology (GO) terms, as were genes associated with signaling via type I and type II IFNs (Fig. 5c and Supplementary Datasets 3 and 6). Some differences between the datasets were also notable. For example, overexpressed marker genes in the primary dataset included IRAK1, IRAK3, and FOS, whereas overexpressed marker genes in the secondary dataset included EIF3AK2, OAS1–3, IFITM1, IFITM3, IFIT3, IFIT1, and IFI44, which encode proteins with antiviral effector functions12,27,28,29,30.
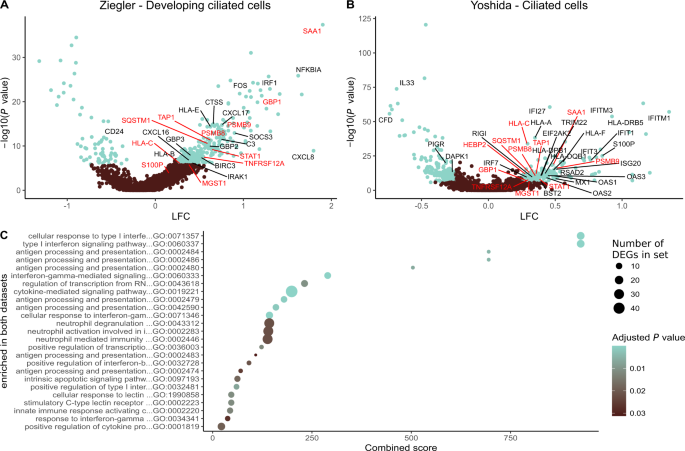
a, b Volcano plots showing DEGs (blue; Padj. < 0.05, absolute LFC > 0.25) among the biggest clusters of ciliated cells from responders in the primary (a) and secondary datasets (b). Genes annotated in red are significant in both datasets, and genes annotated in black are significant in one dataset. c Gene ontology (GO) terms enrichment plot for pathways significantly enriched in both datasets (Padj. < 0.05). Dot size represents the average number of significant DEGs that contributed to the term, and dot color represents the adjusted P value (Padj.). X-axis shows combined scores as reported by enrichR. Source data are provided as supplementary datasets.
Similar enrichments were observed for ciliated cells in pathway analyses aligned to the KEGG database (Supplementary Datasets 2 and 5). Moreover, enriched pathways among ciliated cells from responders exhibited high combined scores for apoptosis, cellular senescence, necroptosis, and signaling via TNF. In the primary dataset, we also found that responders exhibited higher fractions of SARS-CoV-2 RNA-free cells and lower abundances of SARS-CoV-2 RNA in infected cells compared with non-responders (responders, ncells = 11,871; non-responders, ncells = 5386; P = 0.00013), thereby aligning our results with biological efficacy (Supplementary Fig. 8). This analysis was not performed on the secondary dataset, because patients numbers were low and often lacked values for viral RNA.
Collectively, these findings indicated that the presence of T cells expressing mRNA encoding IFN-γ in the upper airways was associated with enhanced target cell conditioning for immune recognition, globally upregulated viral clearance mechanisms, and better localized control of SARS-CoV-2.
