Plain Language Summary
Chemically induced acute lung injury (CALI) has become a serious health concern in our industrialized world, immune cells and functional changes in these cells play a crucial role in the severe clinical symptoms of CALI. However, our knowledge on these cells, their functions, and how they relate to CALI remains limited.
Here we employed single-cell RNA sequencing on fluid samples from the lungs of rats and assessed cell surface markers to understand how metabolic remodeling mechanisms were involved in the progression of ARDS and cytokine storms, tracked the trajectories of one type of immune cells, and corresponding gene expression changes, identified and characterized other cell subsets that may contribute to CALI pathophysiology.
Our findings showed that immune system increased its function during the early stage of pulmonary tissue damage, and immune microenvironment was involved in pathogenesis of and recovery from CALI. They provided fundamental insights into immune response provoked by CALI and natural course and changes in macrophages that occur as a result, revealed novel changes in gene expression and cellular interactions, highlighted the complexity and diversity of cellular injury in CALI. Future research on the transcriptional dysregulations identified in this study would further elucidate the pathophysiology underlying CALI.
Introduction
Lung injury caused by chemical gas inhalation is a common severe disease that can easily progress to acute respiratory distress syndrome (ARDS), which poses a threat to the local civilian population in case of accidental or intentional gas release.1,2 Chemically induced acute lung injury (CALI) can be caused by chemical agents such as phosgene, chlorine, ammonia, and hydrofluoric acid as well as by burns or smoking. Phosgene is an indispensable high-production chemical intermediate widely used across industries. Industrial development has brought about a high annual incidence of CALI; moreover, accidental gas leakages contribute to serious social health problems.3 However, there remain no specific or FDA-licensed drugs to treat CALI.4 To develop novel treatments or effective approaches, it is important to elucidate the pathophysiology underlying CALI, especially at the cellular level.
Inhalation is the primary exposure route for most of the aforementioned toxic chemicals. Typically, alveolar epithelium injury induced by chemicals leads to inflammatory responses, which can cause tissue edema or organ dysfunction.5 CALI is initially characterized by different degrees of congestion, interstitial and alveolar edema, neutrophilic infiltration, occasional hyaline membrane formation, and dense atelectasis.6 The pathophysiological mechanisms include direct chemical-induced airway or bronchus damage, diffused pulmonary edema, and tissue hypoxia caused by systemic poisoning.7,8 As direct damage to the respiratory tract and alveoli causes disruption of the epithelial-endothelial barrier, multiple studies have investigated the regeneration mechanisms in damaged tissues.9–11 However, the host presents with increased susceptibility even after tissue regeneration of the epithelial-endothelial barrier.12 Additionally, the immune microenvironment is crucial in maintaining lung homeostasis, which is essential for adequate gas exchange and alveolar epithelial integrity.13,14 Therefore, it is important to understand the respiratory immune microenvironment, which comprises multiple cell types and cellular communication based on ligand-receptor interactions, to elucidate the pathogenesis underlying CALI.
Research on the interaction between immune response and cellular metabolism has been increasing. Single-cell RNA sequencing (sc-RNAseq) has recently been used to obtain single-cell resolution and identify disease mechanisms, cellular phenotypes, and alterations in alveolar cell crosstalk.15,16 Bronchoalveolar lavage fluid (BALF) can be used to identify the microenvironment of the bronchioles and lung alveoli.17,18 While landscape analysis of the lung immune microenvironment during ALI/ARDS has revealed strong changes in the proportions and characteristics of immune cells, the cell type-specific mechanisms and the complex interactions among immune cell subtypes, especially in CALI, remain unclear.
Here we aimed to elucidate the cell-specific transcriptional profiles of alveolar immune cells in CALI, by subjecting BALF samples to sc-RNAseq, to provide insights into the underlying pathophysiology.
Materials and Methods
Animals and Grouping
We purchased adult male Sprague–Dawley rats (mean weight, 200 ± 20 g; 8–10 weeks old) from the Experimental Animal Center of Naval Medical University, Shanghai, China. Animals were maintained in a climate-controlled cage (temperature, 24–26 °C; humidity, 55%–60%; 12/12 h dark/light cycle), with free access to food and water. All animal experimental procedures were approved by the Institutional Animal Care and Use Committee of Fudan University and adhered to the established international guidelines for animal experimentation.
The rats were randomly allocated to a normal control (NC, n = 6) and a Gas (n = 6) group. The NC group was exposed to normal room air, while the Gas group was exposed to phosgene gas (No. 32315-10-9, Macklin, China) at a constant rate in an airtight cabinet for 5 min until a final concentration of 8.33 mg/L, as previously described.19
Isolation and Preparation of Single Cells and scRNA-Seq
After 24 h, three rats in each group were randomly selected, and ≈ 2 mL of BALF samples were freshly obtained for scRNA-seq. They were passed through a 100-µm nylon cell strainer to remove clumps and debris, followed by supernatant collection. Subsequently, the cells were re-suspended in a cooled RPMI 1640 complete medium. Cells were then counted in 0.4% Trypan blue, centrifuged, and resuspended at a concentration of 1×10⁶ mL−1 for subsequent analyses. All samples were processed in a BSL-3 laboratory within 2 h after collection.
Quality Control (QC) and Data Filtering
scRNA-seq of BALF cells was performed using the BD Rhapsody™ Single-Cell platform. The rat reference genome (version rn6) was applied to align reads and generate the gene-cell unique molecular identifier (UMI) matrix for each sample. The obtained raw_feature_bc_matrix was loaded with downstream analysis using the “Seurat” R package (v 4.1.0).20 Dead cell filtering resulted in a total of 64,329 cells. Further QC was applied step-by-step based on three metrics, including the total UMI counts, number of detected genes, and proportion of mitochondrial gene counts per cell. Cells with < 500 detected genes were filtered out; the mitochondrial gene expression was high (20%). We then filtered out cells with > 6000 detected genes to further remove potential doublets. Genes detected in < 10 cells were also filtered out. Subsequently, the data were normalized and scaled. We removed the batch effect across individuals by identifying anchors passing them to the “IntegrateData” function. Dimensionality was further reduced using a uniform manifold approximation and projection (UMAP) for visualization. Louvain clustering was used to group single cells according to their expression profiles, and a sub-clustering analysis was performed using a similar procedure, which included variable gene identification, dimension reduction, and cell integration.
Identification of Signature Genes and Cell Annotation
Signatures for each cluster were obtained using the “FindAllMarkers” function in the Seurat20 package. Signature genes were identified based on the following criteria: 1) adjusted p < 0.05 using all signatures in the dataset; 2) fold change in mean expression > 0.25; and 3) pct.1 > 0.25 (pct.1: percentage of cells in the first group where the signature was detected).
The main cell types in the main clusters were defined using the SingleR package. Next, we further manually confirmed that the markers expressed by specific cell types were specific to the corresponding clusters using the criteria: pct.1 > 0.6 and pct.2 < 0.4. For subtypes, the cells were named based on their highly expressed signature. Supplementary Table 1 presents detailed information regarding cellular biomarkers.
Identification and Functional Enrichment Analysis of Differentially Expressed Genes (DEGs)
DEGs in the specific between-group cluster were analyzed using the “FindAllMarkers” function in the Seurat package, and the “MAST” algorithm was used to calculate statistical significance. DEGs were identified using the following criteria: absolute log fold-change of the average expression ≥ 0.2 and pct > 0.1 (percentage of cells in which the feature was detected in either group) with p < 0.05. A functional enrichment analysis was performed on identified DEGs.
Functional Enrichment Analysis
The Kyoto Encyclopedia of Genes and Genomes (KEGG) database and Gene Ontology (GO) category databases were used for functional annotation of the DEGs. Enrichment analysis of GO categories was performed using the R cluster Profiler (v3.14.3) package; additionally, enrichment analysis of pathways was tested on hypergeometric distribution using the R “phyper” function. GO categories with a false discovery rate < 0.05 were considered significantly enriched. Moreover, pathways with p < 0.05 were regarded as enriched. Only GO categories or pathways containing ≥ 5 DEGs were included in subsequent analyses.
Single‑cell Trajectory Reconstruction and Analysis
To infer the differentiation trajectory of macrophage subtypes, we first used R monocle (2.18.0)21 to infer the pseudotime of each cell (method = “DDRtree”, ordering genes = marker genes). Single cells are projected onto this space and ordered into trajectories with branch points. Next, we performed branched expression analysis modeling to test branch-dependent gene expression further. Gene changes with pseudotime were calculated (q-val< 1e-6) and visualized as a heatmap.
Cell-Cell Communication
Ligand-receptor crosstalk between single cells was inferred using the Python package Cellphonedb v2.1.4, with default parameters22 based on known protein-protein interaction annotations. We calculated the number of ligand-receptor pairs with intercellular junctions. Cell interactions were calculated separately for each group. Between-cell differential crosstalk was visualized as a heat map.
Gene Set Activity Analysis
Gene signatures related to specific biological processes were collected from the GO and KEGG databases as well as previous reports. AUCell was used to quantify the gene set activity score,23 which was plotted as a heatmap and violin.
Transcription Factor (TF) Regulon Activity
We performed a single-cell level regulon analysis using the SCENIC (Single-Cell Regulatory Network Inference and Clustering) package in R and its Python implementation pySCENIC.24 Co-expressed genes were used to identify and score regulons enriched in each cluster.
Data Analysis and Statistics
All statistical analyses were performed using R software (version 4.0). The ratios of different cell types were compared using the Wilcoxon test. Between-group comparisons were performed using the two-tailed unpaired Student’s t-test. Statistical significance was set at *P < 0.05, **P < 0.005, ***P < 0.001, ****P < 0.0001.
Results
Single-Cell Transcriptomes and Cell Typing of BALF Cells
Several clusters were identified through dimensionality reduction and clustering using the R Seurat package (Supplementary Figure 1A). Datasets were integrated by clustering cells from each dataset separately and assigning cell-type identities, with a focus on the following six clusters for downstream analysis (Figure 1A): epithelial cells (Supplementary Figure 1B), dendritic cells (DCs), monocyte-like alveolar macrophages (AMs), M1-like AMs, AMs, and cyc. AMs. Supplementary Table 1 shows the marker genes used to identify each cellular phenotype.
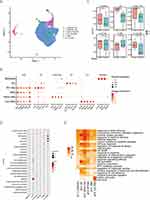 |
Figure 1 Continued. |
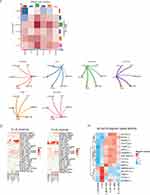 |
Figure 1 Annotation of cell types by scRNA-seq in CALI (Gas) and normal control (NC) samples. (A) ScRNA-seq data represented integrated UMAP in the Gas and NC groups and the individual sample distribution. (B) Dot plot showing the gene expression levels in each cell type, with brightness indicating the log-normalized average expression and circle size indicating the expression percentage. (C) Percentage bar graph showing the distribution of cell types in each sample. (D) Dot panels showing log10(p-value) from enrichment analysis of KEGG pathways in all cell types. (E) Heatmap of -log10(p-value) from the enrichment analysis of GO classification. Each column represents the expression values for each cell. (F) Heatmap of the overall differential cross-talk in the Gas and NC group. Circle network diagram of significant cell-cell interaction pathways. The arrows and edge color indicate direction (ligand: receptor), while edge thickness indicates the sum of weighted paths between populations. (G) Heatmap of the weight of receptor-ligand interactions in cells in the Gas and NC group. (H) All top 16 TF regulatory activities across all cell types. The darker the color, the stronger the regulatory activity. Abbreviations: BALF, bronchoalveolar lavage fluid; CALI, Chemically induced acute lung injury; GO, Gene Ontology; KEGG, Kyoto Encyclopedia of Genes and Genomes; UMAP, uniform manifold approximation and projection; TF, Transcription factor. |
Clustering analysis revealed distinct clusters composed of epithelial cells (Epcam, Krt8), DCs (CD74), monocyte-like cells (Fn1, Cd14), M1-like cells (Il-1b, Ccl9), AMs (Mrc1, Fabp4), and Cyc. AMs (Pcna, Mcm5). Figure 1B and Supplementary Figure 1C present the expression of the representative signature genes. Macrophages accounted for the majority (80%) of detected cells. To analyze the time-course alteration of cellular homeostasis in CALI, we compared the relative proportions of each cell type in both groups. The Gas group showed a non-significant increase in the proportion of epithelial cells, DCs, and other cells (Figure 1C). Since highly expressed cell-specific marker genes can also respond to alterations in cell proportions, we compared the expression of canonical markers, and found that all except the epithelial markers demonstrated significant between-group differences (Supplementary Figure 1D).
We then performed a KEGG pathway enrichment analysis of cluster-specific signatures (Figure 1D and E). The signatures enriched in epithelial cells were associated with “tight junctions” and “protein processing in the endoplasmic reticulum”. DCs were involved in cell differentiation and immune system processes. Cyc_AMs had signatures that were enriched in GO terms mainly related to “cell cycle”, “DNA replication”, and “mismatch repair”, which indicated that cyc_AMs were associated with the recovery phase of lung injury. Notably, monocyte-like AMs responded to immune system processes as well as external stimuli and defense responses, suggesting they mainly activated the innate immune response involved in CALI pathophysiology. Supplementary Figure 1E–H presents the enrichment analysis of representative GO biological pathways.
To identify potential cell-cell interactions conserved across CALI progression, we modeled cases in which cell types within the BALF immune microenvironment expressed both members of a ligand-receptor interaction. There were stronger interactions between epithelial cells and cyc_AMs as well as between myeloid cells. In the Gas group, the heat map showed increased interactions between immune cells as well as between immune and epithelial cells; in contrast, interactions between epithelial and immune cells decreased (Figure 1F). Next, we analyzed the strength of connections between ligands in epithelial cells and the corresponding receptors in other cells. CD74_APP in epithelial cells showed significant interactions with other cells in the NC but not the Gas group, especially with epithelial and monocyte-like cells as well as CD74_COPA (Figure 1G).
The SCENIC algorithm was used to infer the regulatory activity of TFs in cells. A strong regulatory activity indicates that the TF is crucially involved in regulating the biological process of that cell type. Figure 1H shows a heat map of TFs with high regulon activity. For example, TCF3 and NFKB2 showed strong regulatory activities in DCs, and may thus regulate the expression of genes related to specific biological functions of DCs.
scRNA-Seq of DCs and cyc_AMs of BALF in the CALI State
Since we sought to investigate immunological changes during early-stage CALI, we analyzed the role of DCs, which are the strongest antigen-presenting cells, in the effective activation of immune cells. DCs are considered centrally involved in initiating, regulating, and maintaining the immune response. Figure 2A shows the canonical markers of the identified cell types. Comparison of all RNAs in the NC group revealed > 16,433 distinct genes, 1120 of which were DEGs (Figure 2B). GO enrichment analysis of these DEGs revealed they were strongly correlated with immune system processes and cell activation (Figure 2C). Moreover, KEGG enrichment analysis of the DEGs revealed they were strongly correlated with upregulated antigen processing and presentation, apoptosis, and Th 17 cell differentiation pathways (Figure 2D). Taken together, these findings demonstrate that DCs are crucially involved in antigen presentation and the activation of immune function during the early stage of CALI.
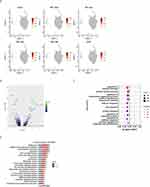 |
Figure 2 Continued. |
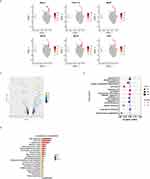 |
Figure 2 scRNA-seq of DCs and cycle_AMs in BALF from the Gas group. (A) UMAP plots showing normalized expression of known markers in DCs. (B) Volcano plot depicting log2(fold-change) and -log10(p-value) between the two sampled time points. Genes are color-coded according to -log10(p-value). Brighter colors represent a significant differential expression. (C) GO enrichment analysis illustrating increased immune activity and cell activation. (D) Bar plot showing the enriched KEGG pathways of DEGs in DCs. Bars indicate the ratio of up- and down-regulated genes. (E) UMAP plots showing normalized expression of known markers in cycle_AMs. (F) Volcano plot depicting log2(fold-change) and -log10(p-value) between the two sampled time points. (G) Dot plot showing enriched GO terms of DEGs in cyc_AMs. The size of the dots is proportional to the number of DEGs in the GO term, while the color corresponds to the –log10(p-value) of the enrichment. Selected top terms are visualized. (H) KEGG pathway analysis illustrates increased DNA replication, cell cycle spliceosome, and mismatch repair in cyc_AMs. Abbreviations: AMs, alveolar macrophages; BALF, bronchoalveolar lavage fluid; DCs, dendritic cells; DEGs, differentially expressed genes; GO, Gene Ontology; KEGG, Kyoto Encyclopedia of Genes and Genomes; UMAP, uniform manifold approximation and projection. |
Additionally, we analyzed cyc_AMs, which comprise the alveolar macrophage population, given the importance of tissue repair after direct alveolar damage. Figure 2E shows the canonical markers of the identified cell types. The transcripts that are significantly regulated are shown in Figure 2F. GO enrichment analysis of cyc_AMs signatures revealed strong correlations with upregulation of the mitotic cell cycle (Figure 2G). Furthermore, KEGG pathway analysis revealed strong correlations with DNA replication and the cell cycle (Figure 2H). Considering the functional subpopulation of AMs that promote tissue repair during lung injury, we hypothesized the presence of a close association with cyc_AMs. Taken together, these findings suggest that cyc_AMs are involved in the recovery phase of the inflammatory response.
Single-Cell Transcriptomes of Macrophage Populations
Next, we analyzed the macrophage-specific features that dynamically changed during CALI since macrophages comprised the majority of detected cells (Figure 1C). Specifically, we performed a sub-clustering analysis of the detected macrophage clusters. To annotate cell types, we analyzed 61,399 AMs using the UMAP algorithm based on variable genes with the Seurat package and identified multiple sub-clusters (Figure 3A and Supplementary Figure 2A). Based on the signature genes, we selected the following biologically significant macrophage clusters for downstream analysis: arachidonate 15-lipoxygenase (Alox15+) macrophages, ATP-binding cassette protein A1 (Abca1+) macrophages, G0/G1 switch gene 2 (G0s2+) macrophages, low-density lipoprotein receptor (Ldlr+) macrophages, microtubules (MTs+) macrophages, Lfits+ macrophages, secreted phosphoprotein 1 (SPP1+) macrophages, M1-like macrophages, and mono-like macrophages (Figure 3B). Figure 3C shows the specific markers used to define each sub-cluster. There were no significant between-group differences in the proportion of each lung macrophage subtype (Figure 3D and Supplementary Figure 2B). However, there was a tendency for increased proportions of G0s2+, Ldlr+, Lfits+, and SPP1+ macrophages in the Gas group. Notably, there were significant between-group differences in the function of each lung macrophage subtype (Figure 3E), which were significantly higher in the Gas group than in the NC group. This suggests that macrophages are crucially involved in the pathophysiology of CALI. Supplementary Figure 2C shows each cluster’s normalized expression levels for the representative marker genes.
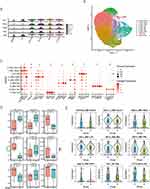 |
Figure 3 Analysis of macrophage subpopulations. (A) Violin plots of normalized expression values for canonical cell-specific marker genes for AM clusters. (B) ScRNA-seq represented the integrated UMAP along with the individual sample distribution. (C) Dot plot showing the gene expression levels in each sub-cell type, with brightness indicating the log-normalized average expression and circle size indicating the expression percentage. (D) Percentage bar graph showing the distribution of cell types in each sample. (E) Violin plots indicating between-group differences in the expression levels of canonical markers. The p-values are calculated using a two-sided Wilcoxon signed-rank test from a theoretical null distribution. (**P < 0.005, ***P < 0.001, ****P < 0.0001). Abbreviations: AM, alveolar macrophage; UMAP, uniform manifold approximation and projection. |
Transcriptomic Changes in Each Macrophage Subpopulation
Next, we focused on changes in the transcriptome of each macrophage subpopulation. We performed pseudotime trajectory analysis to infer lineage relationships among the macrophage subsets. scRNA-seq can capture all cell types at a given time point to yield a series of expression profiles among cells as they transition across states. To elucidate the transitional processes of macrophage development, we performed pseudotime analysis using all AMs. We found that Alox15+ and Ldlr+ macrophages were in the same state, as were the remaining cell subtypes. This characteristic was also observed in Alox15+ and Abca1+ macrophages concerning cell-specific gene expression (Supplementary Figure 3A), which suggests that the macrophage subsets began to evolve from Alox15+ and Abca1+ macrophages and developed into two differentiation branches (Supplementary Figure 3B) toward G0s2+ and Ldlr+ macrophages (B1 and B2 branches, respectively; Figure 4A). Figure 4B shows the proposed chronology of the cells, with G0s2+ macrophages showing the largest chronological value. Similarly, as shown in Figure 4C, cells in the Gas group mainly comprised those with large chronological values and were more biased toward the aforementioned differentiation branches. Figure 4D also reflects this phenomenon. Indeed, there were between-group differences in the evolution of macrophages, with cells in the Gas group evolving more toward functional cells. Supplementary Figure 3C shows the distribution of macrophage states across subtypes.
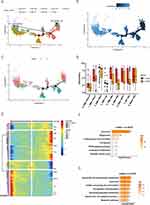 |
Figure 4 Continued. |
 |
Figure 4 Pseudotime analysis of macrophages in BALF. (A) Trajectory of the macrophage subtypes in the reduced dimensional space. The points are colored according to cell types, and the two branches are labeled. (B) Pseudotime of macrophages in the reduced dimensional space. The points are colored according to the gradient of the pseudotime. (C) Distribution of macrophages from different groups along the pseudotime trajectory. The points are colored according to the groups. (D) Box plot of pseudotime distribution between groups. (E) Branch heatmap visualizing changes for all genes that are significantly branch-dependent. Columns represent points in pseudotime, rows represent genes, and the pseudotime begins in the middle of the heatmap. Genes were clustered based on their expression pattern, with four gene clusters being detected. KEGG enrichment analysis of genes in cluster 1 (F), cluster 2 (G), cluster 3 (H), and cluster 4 (I). Abbreviations: BALF, bronchoalveolar lavage fluid; KEGG, Kyoto Encyclopedia of Genes and Genomes. |
We then calculated the related differential genes across the two differentiation branches and created a clustered heatmap (Figure 4E). Each row represents a gene; further, each column of samples was arranged in quasi-chronological order of each cell, with genes in the pre-branch, B2 branch, and B1 branch being located in the middle, left, and right, respectively. Genes were clustered into four classes based on the expression trend. The top-down classes comprised genes highly expressed from the pre-branch to the B1 branch. G0s2+, Abca1+, MTs+, and Spp1+ macrophages tended to cluster more in the B1 branch. Cluster 1 comprised genes highly expressed in the B1 branch.
Subsequently, we performed a KEGG analysis of genes in each gene cluster. The B1 branch was enriched with genes that mainly corresponded to lysosomes, phagosomes, iron death, and cholesterol metabolism (Figure 4F). The main functions of genes highly expressed from the pre-branch to the B1 branch (cluster 2) included metabolism (glycometabolism), lysosome, and antigen processing/presentation (Figure 4G). Genes highly expressed in the B2 branch (cluster 3) were mainly involved in steroid metabolism (Figure 4H), while those highly expressed in the pre-branch (cluster 4) were mainly related to phagosomes and focal adhesion (Figure 4I).
Functional Diversity of Each Macrophage Subpopulation
To elaborate on the macrophage subtypes, we performed a KEGG enrichment analysis to infer functionality based on cluster-specific DEGs (Figure 5A); moreover, we visualized the top enriched GO terms for each cluster (Figure 5B). For example, MTS+ and Lfits+ macrophages were more inclined toward the immune process. Specifically, monocyte-like macrophages were crucially involved in the immune defense response and the response to external stimuli, which indicates that they play an important role in the early stage of CALI.
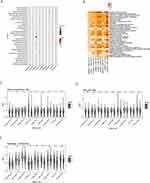 |
Figure 5 Continued. |
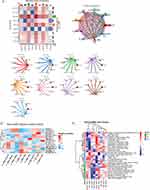 |
Figure 5 (A) Dot panels showing the -log10 (p-value) from the enrichment analysis of KEGG pathways for all cells. (B) Heatmap of the -log10(p-value) of GO enrichment for all cells. Violin plots indicate between-group differences in the gene-related activity of steroid biosynthesis (C), cell polar (D), and autophagy (E). (F) Cell-cell ligand-receptor network analysis. Circle network diagram of significant cell-cell interaction pathways. The arrows and edge color indicate direction (ligand: receptor), while edge thickness indicates the sum of weighted paths between populations. Heatmap of differential interactions between the Gas and NC groups. (G) Heatmap showing the regulatory activity of top TFs across the cell types. The darker the color, the stronger the regulatory activity. (H) Expression activity of selected functional gene sets across cell types was calculated using AUCell. (*P < 0.05, **P < 0.005, ****P < 0.0001, NS, no significant). Abbreviations: GO, Gene Ontology; KEGG, Kyoto Encyclopedia of Genes and Genomes; NC, normal control; TF, Transcription factor. |
Subsequently, we identified several functional gene signatures from the GO and KEGG databases; then, we calculated the expression activity of these signatures using the “AUCell” method. In the Gas group, Ldlr+ macrophages showed significantly increased expression of genes related to steroid biosynthesis (Figure 5C). Macrophage polarization generally increased across the cells (Figure 5D). Moreover, G0s2+ and MTs+ macrophages showed significantly more pronounced autophagy (Figure 5E). Supplementary Figure 4A–D presents examples of the other classic important functional gene signatures.
Permutation testing with weighted edges reflecting expression fold changes of ligands and receptors in the source and target populations revealed a strong connection between Alox15+ and Abca1+ macrophages (Figure 5F). We performed between-group comparisons of variations in the strength of inter-cellular interactions. An increase and decrease in interaction were indicated by red and blue, respectively, with a darker color indicating a greater increase or decrease. Notably, although the graph rows and columns have the same name, they represent different meanings. Specifically, each row and column represent the cell in which the ligand and receptor reside. In the Gas group, there was an increase in most interactions in the macrophages, except for the Lfits+ and Ldlr+ subtypes. For example, there were increased interactions between ligands in Abca1+ macrophages and receptors in Alox15+ macrophages.
The regulatory activity of TFs in single cells was analyzed using SCENIC software. For single-cell transcriptomes, detecting differences in TF activity can provide insights into cell heterogeneity and facilitate the analysis of key regulatory mechanisms. In Figure 5G, the redder the color, the greater the regulatory activity of the TF (Figure 5G). Alox15+ and Ldlr+ macrophages showed similar activity, as did the other cells. A similar phenomenon was observed in functional gene sets expressed in Alox15+ and Abca1+ macrophages, suggesting that cells evolved from Alox15+ and Abca1+ macrophages to the B1 and B2 branches (Figure 5H). Subsequently, we evaluated the functional characteristics of the macrophage subtypes from various perspectives, including immunity, cell death, metabolism, and macrophage polarization. In the Gas group, the macrophages were functionally enriched in immune responses, cell death, and cell metabolism, which are hallmark functions of pro-inflammatory macrophages (Supplementary Figure 4E–H). Taken together, these findings demonstrate that macrophages display a specific functional diversity during CALI. Notably, they reveal that the activity of metabolic pathways across macrophage subtypes is influenced by hypoxia status.
Discussion
In this study, we investigated the single-cell transcriptional profiles of pulmonary immune cells and identified transcriptional cell-specific profiles that may contribute to the pathophysiology of CALI. We found that the immune environment of BALF cells, including DCs and specific macrophage subclusters, exhibits an increase in functions during early-stage CALI. Notably, among macrophages, which represent the majority of all detected cells, we identified nine subpopulations with multiple functional roles, including immune response, pulmonary tissue repair, cellular metabolic cycle, and cholesterol metabolism. The predominant dynamic transcriptome changes involved Alox15+ and Abca1+ macrophages, with differentiation into other macrophages. Furthermore, we performed pseudotime trajectory analysis to explore the chronological relationships among the macrophage subsets. However, since antigen-specific responses are initiated a few days after injury, they could be preceded by bystander activation of tissue-resident AMs.
There has been an annual increase in the incidence of phosgene-induced CALI. Phosgene causes lesions of the pulmonary alveolus–capillary membrane (epithelial–endothelial barrier), which results in liquid aggregation in the pulmonary alveoli and interstitium.24 However, therapeutic strategies targeting the repair of the damaged epithelial-endothelial barrier have not been effective. Instead, research on changes in the immune microenvironment, especially phenotypical and functional alterations of alveolar immune cells, has been increasing. BALF is a sampling technique used to freshly obtain immune cell suspensions from the lower respiratory tract, which can be detected through flow cytometry or single-cell sequencing. BALF contains microenvironment information regarding bronchioles and lung alveoli; moreover, it is less invasive than surgical lung biopsy.25 Analyzing BALF cells can help elucidate the immune landscape of viral infections. Accordingly, analyzing this immune landscape in an animal model can facilitate the translation of the findings to human disease pathophysiology.26
The diversity of macrophages under healthy and disease conditions has recently become more appreciated, with distinct macrophage subsets showing characteristic localizations and functions.27,28 Two primary resident macrophage subsets have been characterized under homeostatic conditions. Specifically, AMs, the most abundant subtype in lung tissue, are located in the airway lumen and are crucially involved in lung development and the generation of balanced inflammatory responses. Additionally, they play a major role in maintaining lipid homeostasis, which is essential for adequate gas exchange and alveolar epithelial integrity.29 Furthermore, AMs have other functions, such as clearing surfactant components, cellular debris, inhaled particulates, and pathogens.30 In the current study, BALF derived from our CALI model exhibited diverse macrophage subtypes. Macrophages are morphologically and phenotypically diverse cells31 that promote the existence of cells with high inflammatory potential. Therefore, they are crucially involved in mediating acute immune responses that cause pathological tissue damage and immune microenvironment alterations with severe disease.32 In the Gas group, we observed significant functional alterations in macrophages, which indicate that macrophages are the most enriched immune cell types in the lungs of patients with CALI or ARDS and are crucially involved in the dysregulated innate immune responses with exaggerated inflammatory cytokine production. Previous studies have reported genes related to AMs; for example, G0s2 expression is positively correlated with the apoptosis of macrophages.33 In macrophages, ALOX15 generates specific phospholipid (PL) oxidation products crucial in the nonimmunogenic removal of apoptotic cells and the synthesis of precursor lipids required to produce specialized pro-resolving mediators.34 In addition, Abca1 is highly regulated in macrophages and mediates the efflux of cholesterol and phospholipids into apolipoproteins, which is necessary for high-density lipoprotein formation.35SPP1 indicates alternative M2-like macrophages, which are a reparative but profibrotic subset.18 Therefore, it is important to further elucidate the normal cellular composition and functional diversity of AM subtypes to allow more accurate characterization of disease-related transcriptional changes and the specific targeting of subtypes to restore immune balance. Recent reports indicating that metabolism remodeling is essential for macrophage-mediated inflammatory responses support the notion that macrophages with high metabolic activity tend to have inflammatory potential.36,37 In our regulon analysis, each AM subtype showed a distinct set of TFs. Future studies on the specific TFs that regulate each AM subtype are therefore warranted.38
Our study’s pseudotime trajectory analysis suggested that the proliferating macrophage cluster was derived from Alox15+ and Abca1+ macrophages, with subsequent differentiation into two branches. This is consistent with previous reports on the maintenance of tissue-resident macrophages regulated by local lung proliferation.39,40 Further, analysis of the interactions between circulating ligands and receptors on the BALF cells revealed a chronological order of cellular communication in the lung associated with disease severity. Significant between-group differences existed in the interaction networks between AMs or DCs and immune cells, with the Gas group showing more AM-immune cell interactions. Further, the Gas group showed an increase in most interactions within the macrophage subtypes. Taken together, these findings show that AMs exhibit improved cross-talking with their lung-localized microenvironment in CALI, which facilitates “organized” immune reactions that can resolve, rather than exacerbate, inflammation and tissue repair.41
However, this study has several limitations. First, although transcriptional alterations are informative, they do not always reflect gene/protein concentration or function. Therefore, future studies are warranted to elucidate the mechanisms by which the identified transcriptional phenotypes of alveolar cells in CALI contribute to disease pathogenesis. Second, we included a small sample size and did not obtain longitudinal samples collected before and after model establishment. Therefore, our findings should be validated by future prospective studies, especially studies involving clinical patients.
Conclusion
This study provides fundamental insight into the immune response provoked by CALI and the natural course and changes in macrophages. Specifically, our findings reveal novel changes in gene expression and cellular interactions in DCs and macrophage subpopulations, highlighting the complexity and diversity of cellular injury and inflammation in CALI. Future studies on the identified transcriptional dysregulations could help further elucidate the pathophysiology underlying CALI.
Data Sharing Statement
The data that support the findings of this study are available from the corresponding author upon reasonable request.
Ethics Approval Statement
Animal protocols were approved by the Institutional Animal Care and Use Committee of Jinshan Hospital, Fudan University, China, and complied with the revised Animals (Scientific Procedures) Act 1986 in the UK and Directive 2010/63/EU in Europe.
Acknowledgments
We thank Pro. Yanfen Chai and Songtao Shou of Emergency Department, Tianjin Medical University General Hospital for their technical assistance and helpful discussions.
Author Contributions
All authors made a significant contribution to the work reported, whether that is in the conception, study design, execution, acquisition of data, analysis and interpretation, or in all these areas; took part in drafting, revising or critically reviewing the article; gave final approval of the version to be published; have agreed on the journal to which the article has been submitted; and agree to be accountable for all aspects of the work.
Funding
This work was supported by grants from the National Natural Science Foundation of China (No. 81902007 to CC, 82072222 to HJ, 82272243 to JS), the Natural Science Foundation of Tianjin (No. 19JCQNJC10000 to CC), the Binhai New District Health Commission Science Foundation of Tianjin (No. 2019BWKY012 to CC), the Shanghai Municipal Science and Technology Major Project (No. ZD2021CY001 to JZ), and the Science and Technology Committee of Jinshan District, Shanghai (No. 2019-3-07 to JS).
Disclosure
The authors report no conflicts of interest in this work.
References
1. Summerhill EM, Hoyle GW, Jordt SE, et al. An Official American Thoracic Society Workshop Report: chemical inhalational disasters. Biology of lung injury, development of novel therapeutics, and medical preparedness. Ann Am Thorac Soc. 2017;14:1060–1072. doi:10.1513/AnnalsATS.201704-297WS
2. Nicholson-Roberts TC. Phosgene use in World War 1 and early evaluations of pathophysiology. J R Army Med Corps. 2019;165:183–187. doi:10.1136/jramc-2018-001072
3. Holmes WW, Keyser BM, Paradiso DC, et al. Conceptual approaches for treatment of phosgene inhalation-induced lung injury. Toxicol Lett. 2016;244:8–20. doi:10.1016/j.toxlet.2015.10.010
4. Radbel J, Laskin DL, Laskin JD, Kipen HM. Disease-modifying treatment of chemical threat agent-induced acute lung injury. Ann N Y Acad Sci. 2020;1480:14–29. doi:10.1111/nyas.14438
5. Boor PJ, Gotlieb AI, Joseph EC, Kerns WD, Roth RA, Tomaszewski KE. Chemical-induced vasculature injury. Summary of the symposium presented at the 32nd annual meeting of the Society of Toxicology, New Orleans, Louisiana, March 1993. Toxicol Appl Pharmacol. 1995;132:177–195. doi:10.1006/taap.1995.1098
6. Pallua N, Warbanow K, Noah EM, et al. Intrabronchial surfactant application in cases of inhalation injury: first results from patients with severe burns and ARDS. Burns. 1998;24:197–206. doi:10.1016/s0305-4179(97)00112-5
7. Greenhalgh DG. Management of burns. N Engl J Med. 2019;380:2349–2359. doi:10.1056/NEJMra1807442
8. Lu Q, Huang S, Meng X, et al. Mechanism of phosgene-induced acute lung injury and treatment strategy. Int J Mol Sci. 2021;22:10933. doi:10.3390/ijms222010933
9. Davey A, McAuley DF, O’Kane CM. Matrix metalloproteinases in acute lung injury: mediators of injury and drivers of repair. Eur Respir J. 2011;38:959–970. doi:10.1183/09031936.00032111
10. Rodríguez-Castillo JA, Pérez DB, Ntokou A, Seeger W, Morty RE, Ahlbrecht K. Understanding alveolarization to induce lung regeneration. Respir Res. 2018;19:148. doi:10.1186/s12931-018-0837-5
11. Spella M, Lilis I, Stathopoulos GT. Shared epithelial pathways to lung repair and disease. Eur Respir Rev. 2017;26:170048. doi:10.1183/16000617.0048-2017
12. Hong KU, Reynolds SD, Giangreco A, Hurley CM, Stripp BR. Clara cell secretory protein-expressing cells of the airway neuroepithelial body microenvironment include a label-retaining subset and are critical for epithelial renewal after progenitor cell depletion. Am J Respir Cell Mol Biol. 2001;24:671–681. doi:10.1165/ajrcmb.24.6.4498
13. Buckley S, Shi W, Carraro G, et al. The milieu of damaged alveolar epithelial type 2 cells stimulates alveolar wound repair by endogenous and exogenous progenitors. Am J Respir Cell Mol Biol. 2011;45:1212–1221. doi:10.1165/rcmb.2010-0325OC
14. Nonaka PN, Uriarte JJ, Campillo N, Oliveira VR, Navajas D, Farré R. Lung bioengineering: physical stimuli and stem/progenitor cell biology interplay towards biofabricating a functional organ. Respir Res. 2016;17:161. doi:10.1186/s12931-016-0477-6
15. Hurskainen M, Mižíková I, Cook DP, et al. Single cell transcriptomic analysis of murine lung development on hyperoxia-induced damage. Nat Commun. 2021;12:1565. doi:10.1038/s41467-021-21865-2
16. Sun Z, Chen L, Xin H, et al. A Bayesian mixture model for clustering droplet-based single-cell transcriptomic data from population studies. Nat Commun. 2019;10:1649. doi:10.1038/s41467-019-09639-3
17. Sauler M, McDonough JE, Adams TS, et al. Characterization of the COPD alveolar niche using single-cell RNA sequencing. Nat Commun. 2022;13:494. doi:10.1038/s41467-022-28062-9
18. Liao M, Liu Y, Yuan J, et al. Single-cell landscape of bronchoalveolar immune cells in patients with COVID-19. Nat Med. 2020;26:842–844. doi:10.1038/s41591-020-0901-9
19. He DK, Xu N, Shao YR, Shen J. NLRP3 gene silencing ameliorates phosgene-induced acute lung injury in rats by inhibiting NLRP3 inflammasome and proinflammatory factors, but not anti-inflammatory factors. J Toxicol Sci. 2020;45:625–637. doi:10.2131/jts.45.625
20. Adams TS, Schupp JC, Poli S, et al. Single-cell RNA-seq reveals ectopic and aberrant lung-resident cell populations in idiopathic pulmonary fibrosis. Sci Adv. 2020;6:eaba1983. doi:10.1126/sciadv.aba1983
21. Qiu X, Mao Q, Tang Y, et al. Reversed graph embedding resolves complex single-cell trajectories. Nat Methods. 2017;14:979–982. doi:10.1038/nmeth.4402
22. Efremova M, Vento-Tormo M, Teichmann SA, Vento-Tormo R. CellPhoneDB: inferring cell-cell communication from combined expression of multi-subunit ligand-receptor complexes. Nat Protoc. 2020;15:1484–1506. doi:10.1038/s41596-020-0292-x
23. Aibar S, Gonzalez-Blas CB, Moerman T, et al. SCENIC: single-cell regulatory network inference and clustering. Nat Methods. 2017;14:1083–1086. doi:10.1038/nmeth.4463
24. Duniho SM, Martin J, Forster JS, et al. Acute changes in lung histopathology and bronchoalveolar lavage parameters in mice exposed to the choking agent gas phosgene. Toxicol Pathol. 2002;30:339–349. doi:10.1080/01926230252929918
25. Chua RL, Lukassen S, Trump S, et al. COVID-19 severity correlates with airway epithelium-immune cell interactions identified by single-cell analysis. Nat Biotechnol. 2020;38:970–979. doi:10.1038/s41587-020-0602-4
26. Lee JS, Koh JY, Yi K, et al. Single-cell transcriptome of bronchoalveolar lavage fluid reveals sequential change of macrophages during SARS-CoV-2 infection in ferrets. Nat Commun. 2021;12:4567. doi:10.1038/s41467-021-24807-0
27. Gibbings SL, Goyal R, Desch AN, et al. Transcriptome analysis highlights the conserved difference between embryonic and postnatal-derived alveolar macrophages. Blood. 2015;126:1357–1366. doi:10.1182/blood-2015-01-624809
28. Chakarov S, Lim HY, Tan L, et al. Two distinct interstitial macrophage populations coexist across tissues in specific subtissular niches. Science. 2019;363:eaau0964. doi:10.1126/science.aau0964
29. Kopf M, Schneider C, Nobs SP. The development and function of lung-resident macrophages and dendritic cells. Nat Immuno. 2015;16:36–44. doi:10.1038/ni.3052
30. Arandjelovic S, Ravichandran KS. Phagocytosis of apoptotic cells in homeostasis. Nat Immunol. 2015;16:907–917. doi:10.1038/ni.3253
31. Baasch S, Giansanti P, Kolter J, et al. Cytomegalovirus subverts macrophage identity. Cell. 2021;184:3774–3793. doi:10.1016/j.cell.2021.05.009
32. Artyomov MN, Sergushichev A, Schilling JD. Integrating immunometabolism and macrophage diversity. Semin Immunol. 2016;28:417–424. doi:10.1016/j.smim.2016.10.004
33. Hu X, Luo H, Dou C, et al. Metformin triggers apoptosis and induction of the G0/G1 switch 2 gene in macrophages. Genes. 2021;12:1437. doi:10.3390/genes12091437
34. Snodgrass RG, Brüne B. Regulation and functions of 15-Lipoxygenases in human macrophages. Front Pharmacol. 2019;10:719. doi:10.3389/fphar.2019.00719
35. Haghpassand M, Bourassa PA, Francone OL, Aiello RJ. Monocyte/macrophage expression of ABCA1 has minimal contribution to plasma HDL levels. J Clin Invest. 2001;108:1315–1320. doi:10.1172/JCI12810
36. Biswas SK. Metabolic reprogramming of immune cells in cancer progression. Immunity. 2015;43:435–449. doi:10.1016/j.immuni.2015.09.001
37. Ma J, Wei K, Liu J, et al. Glycogen metabolism regulates macrophage-mediated acute inflammatory responses. Nat Commun. 2020;11:1769. doi:10.1038/s41467-020-15636-8
38. Li X, Kolling FW, Aridgides D, Mellinger D, Ashare A, Jakubzick CV. ScRNA-seq expression of IFI27 and APOC2 identifies four alveolar macrophage superclusters in healthy BALF. Life Sci Alliance. 2022;5:e202201458. doi:10.26508/lsa.202201458
39. Hashimoto D, Chow A, Noizat C, et al. Tissue-resident macrophages self-maintain locally throughout adult life with minimal contribution from circulating monocytes. Immunity. 2013;38:792–804. doi:10.1016/j.immuni.2013.04.004
40. Sajti E, Link VM, Ouyang Z, et al. Transcriptomic and epigenetic mechanisms underlying myeloid diversity in the lung. Nat Immunol. 2020;21:221–231. doi:10.1038/s41590-019-0582-z
41. Wauters E, Van Mol P, Garg AD, et al. Discriminating mild from critical COVID-19 by innate and adaptive immune single-cell profiling of bronchoalveolar lavages. Cell Res. 2021;31:272–290. doi:10.1038/s41422-020-00455-9
